Exhibit 99.1
|
|
NAPTP MLP Investor Conference May 2015 |
Exhibit 99.1
|
|
NAPTP MLP Investor Conference May 2015 |
|
|
FORWARD-LOOKING STATEMENTS This presentation contains forward-looking statements. All statements, other than statements of historical facts, included in this presentation that address activities, events or developments that Antero Midstream Partners LP, and its subsidiaries (collectively, the “Partnership”) expect, believe or anticipate will or may occur in the future are forward-looking statements. The words “believe,” “expect,” “anticipate,” “plan,” “intend,” “estimate,” “project,” “foresee,” “should,” “would,” “could,” or other similar expressions are intended to identify forward-looking statements. However, the absence of these words does not mean that the statements are not forward-looking. Without limiting the generality of the foregoing, forward-looking statements contained in this presentation specifically include expectations of plans, strategies, objectives, and anticipated financial and operating results of the Partnership and Antero Resources Corporation (“Antero Resources”). These statements are based on certain assumptions made by the Partnership and Antero Resources based on management’s experience and perception of historical trends, current conditions, anticipated future developments and other factors believed to be appropriate. Such statements are subject to a number of assumptions, risks and uncertainties, many of which are beyond the control of the Partnership, which may cause actual results to differ materially from those implied or expressed by the forward-looking statements. These include the factors discussed or referenced under the heading “Item 1A. Risk Factors” in our Annual Report on Form 10-K for the year ended December 31, 2014 and in the Partnership’s subsequent filings with the SEC. The Partnership cautions you that these forward-looking statements are subject to risks and uncertainties that may cause these statements to be inaccurate, and readers are cautioned not to place undue reliance on such statements. These risks include, but are not limited to, Antero Resources’ ability to meet its drilling and development plan, commodity price volatility, inflation, environmental risks, drilling and completion and other operating risks, regulatory changes, the uncertainty inherent in projecting future rates of production, cash flow and access to capital, the timing of development expenditures, and the other risks discussed or referenced under the heading “Item 1A. Risk Factors” in the Partnership’s Annual Report on Form 10-K for the year ended December 31, 2014 and in the Partnership’s subsequent filings with the SEC. Any forward-looking statement speaks only as of the date on which such statement is made, and the Partnership undertakes no obligation to correct or update any forward-looking statement, whether as a result of new information, future events or otherwise, except as required by applicable law. 1 |
|
|
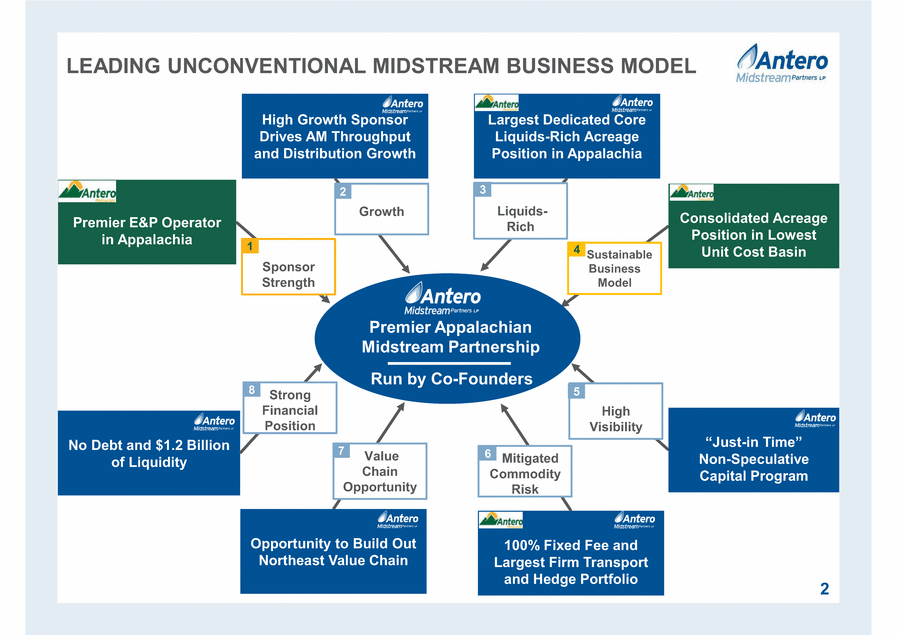
Sustainable Business Model High Growth Sponsor Drives AM Throughput and Distribution Growth Largest Dedicated Core Liquids-Rich Acreage Position in Appalachia No Debt and $1.2 Billion of Liquidity 2 Premier E&P Operator in Appalachia 100% Fixed Fee and Largest Firm Transport and Hedge Portfolio Opportunity to Build Out Northeast Value Chain Growth Liquids-Rich Value Chain Opportunity High Visibility Sponsor Strength LEADING UNCONVENTIONAL MIDSTREAM BUSINESS MODEL Non-Speculative Capital Program Strong Financial Position Mitigated Commodity Risk 1 2 3 4 5 6 7 8 Premier Appalachian Midstream Partnership Run by Co-Founders Consolidated Acreage Position in Lowest Unit Cost Basin “Just-in Time” |
|
|
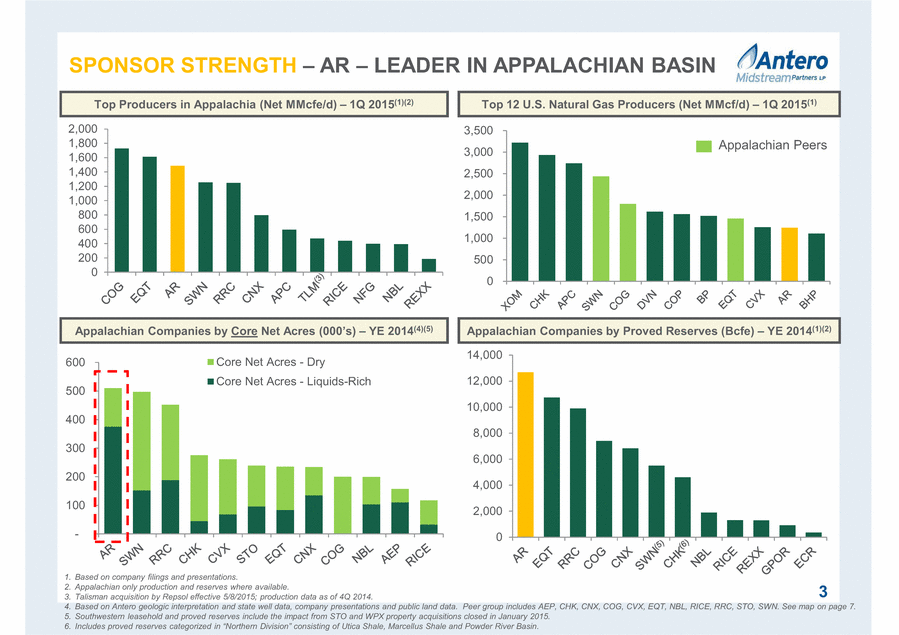
0 500 1,000 1,500 2,000 2,500 3,000 3,500 Appalachian Peers - 100 200 300 400 500 600 Core Net Acres - Dry Core Net Acres - Liquids-Rich 0 2,000 4,000 6,000 8,000 10,000 12,000 14,000 SPONSOR STRENGTH AR LEADER IN APPALACHIAN BASIN 3 Top Producers in Appalachia (Net MMcfe/d) 1Q 2015(1)(2) Top 12 U.S. Natural Gas Producers (Net MMcf/d) 1Q 2015(1) Appalachian Companies by Proved Reserves (Bcfe) YE 2014(1)(2) Appalachian Companies by Core YE 2014(4)(5) 1. Based on company filings and presentations. 2. Appalachian only production and reserves where available. 3. Talisman acquisition by Repsol effective 5/8/2015; production data as of 4Q 2014. 4. Based on Antero geologic interpretation and state well data, company presentations and public land data. Peer group includes AEP, CHK, CNX, COG, CVX, EQT, NBL, RICE, RRC, STO, SWN. See map on page 7. 5. Southwestern leasehold and proved reserves include the impact from STO and WPX property acquisitions closed in January 2015. 6. 0 200 400 600 800 1,000 1,200 1,400 1,600 1,800 2,000 Includes proved reserves categorized in “Northern Division” consisting of Utica Shale. Marcellus Shale and Powder River Basin. |
|
|
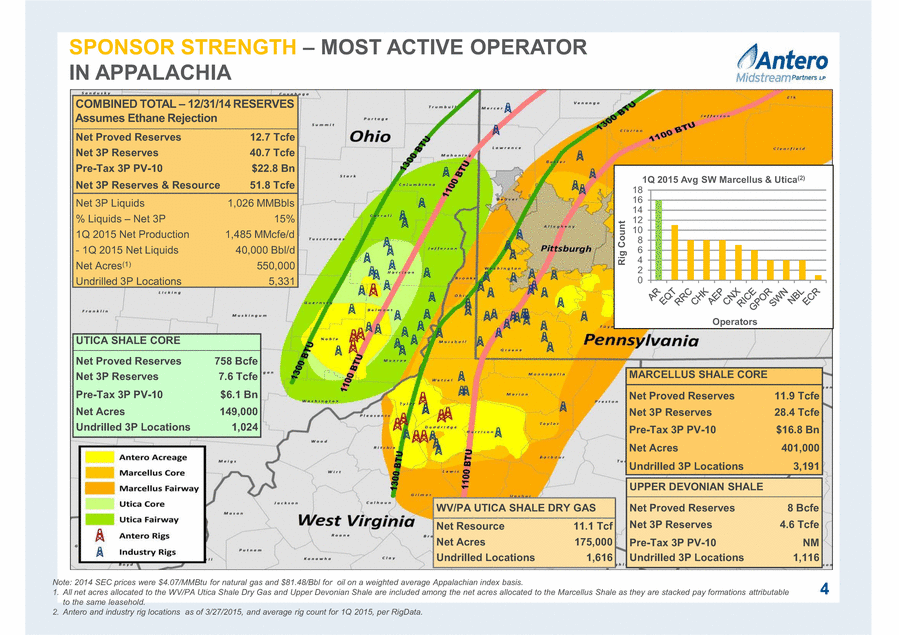
Note: 2014 SEC prices were $4.07/MMBtu for natural gas and $81.48/Bbl for oil on a weighted average Appalachian index basis. 1. All net acres allocated to the WV/PA Utica Shale Dry Gas and Upper Devonian Shale are included among the net acres allocated to the Marcellus Shale as they are stacked pay formations attributable to the same leasehold. 2. Antero and industry rig locations as of 3/27/2015, and average rig count for 1Q 2015, per RigData. SPONSOR STRENGTH MOST ACTIVE OPERATOR IN APPALACHIA 4 COMBINED TOTAL 12/31/14 RESERVES Assumes Ethane Rejection Net Proved Reserves 12.7 Tcfe Net 3P Reserves 40.7 Tcfe Pre-Tax 3P PV-10 $22.8 Bn Net 3P Reserves & Resource 51.8 Tcfe Net 3P Liquids 1,026 MMBbls % Liquids Net 3P 15% 1Q 2015 Net Production 1,485 MMcfe/d - 1Q 2015 Net Liquids 40,000 Bbl/d Net Acres(1) 550,000 Undrilled 3P Locations 5,331 UTICA SHALE CORE Net Proved Reserves 758 Bcfe Net 3P Reserves 7.6 Tcfe Pre-Tax 3P PV-10 $6.1 Bn Net Acres 149,000 Undrilled 3P Locations 1,024 MARCELLUS SHALE CORE Net Proved Reserves 11.9 Tcfe Net 3P Reserves 28.4 Tcfe Pre-Tax 3P PV-10 $16.8 Bn Net Acres 401,000 Undrilled 3P Locations 3,191 UPPER DEVONIAN SHALE Net Proved Reserves 8 Bcfe Net 3P Reserves 4.6 Tcfe Pre-Tax 3P PV-10 NM Undrilled 3P Locations 1,116 WV/PA UTICA SHALE DRY GAS Net Resource 11.1 Tcf Net Acres 175,000 Undrilled Locations 1,616 0 2 4 6 8 10 12 14 16 18 Rig Count Operators 1Q 2015 Avg SW Marcellus & Utica(2) |
|
|
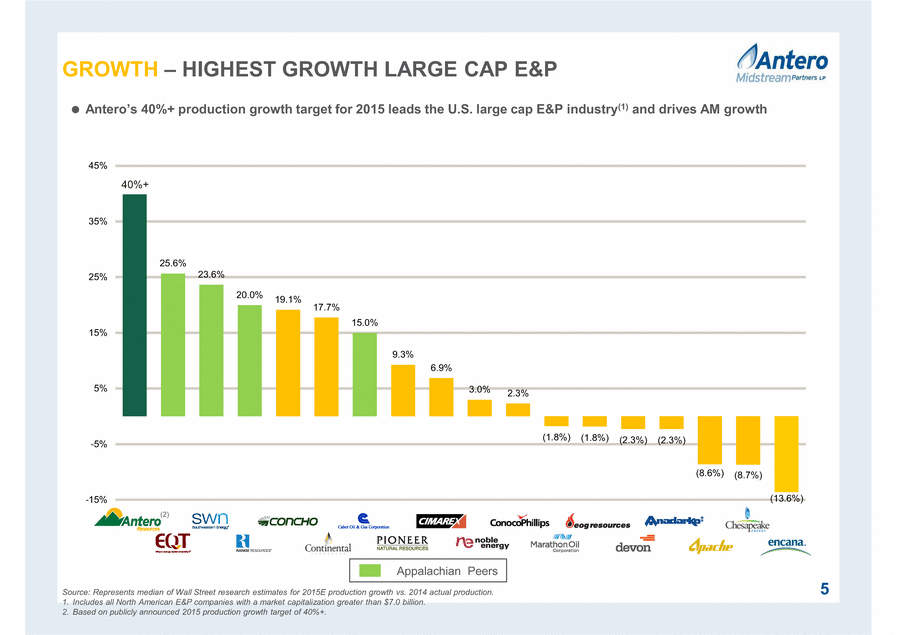
40.0% 25.6% 23.6% 20.0% 19.1% 17.7% 15.0% 9.3% 6.9% 3.0% 2.3% (1.8%) (1.8%) (2.3%) (2.3%) (8.6%) (8.7%) (13.6%) -25% -15% -5% 5% 15% 25% 35% 45% 40%+ 5 Appalachian Peers Source: Represents median of Wall Street research estimates for 2015E production growth vs. 2014 actual production. 1. Includes all North American E&P companies with a market capitalization greater than $7.0 billion. 2. Based on publicly announced 2015 production growth target of 40%+. (1) and drives AM growth GROWTH HIGHEST GROWTH LARGE CAP E&P (2) |
|
|
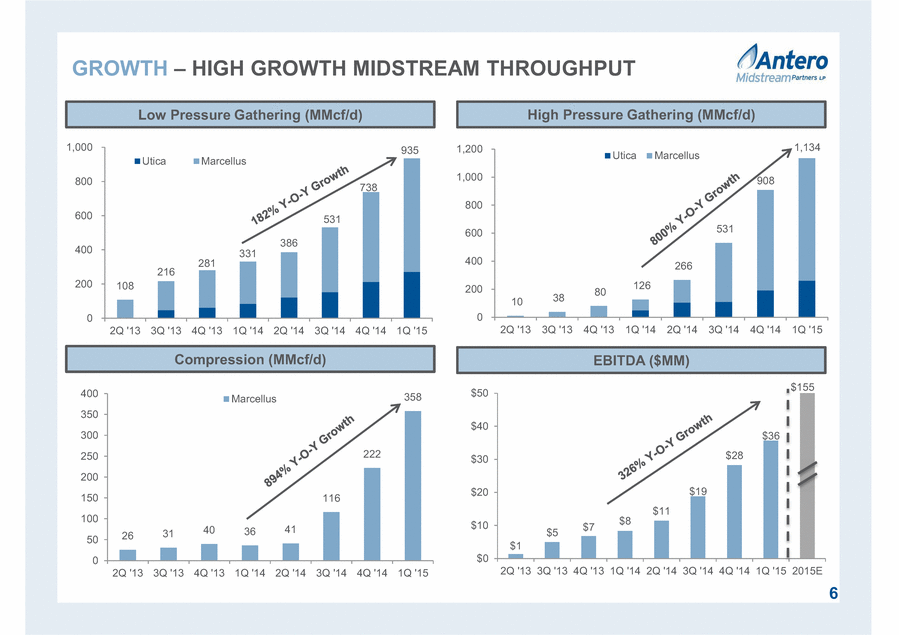
$1 $5 $7 $8 $11 $19 $28 $36 $0 $10 $20 $30 $40 $50 2Q '13 3Q '13 4Q '13 1Q '14 2Q '14 3Q '14 4Q '14 1Q '15 2015E 10 38 80 126 266 531 908 1,134 0 200 400 600 800 1,000 1,200 2Q '13 3Q '13 4Q '13 1Q '14 2Q '14 3Q '14 4Q '14 1Q '15 Utica Marcellus 26 31 40 36 41 116 222 358 0 50 100 150 200 250 300 350 400 2Q '13 3Q '13 4Q '13 1Q '14 2Q '14 3Q '14 4Q '14 1Q '15 Marcellus 108 216 281 331 386 531 738 935 0 200 400 600 800 1,000 2Q '13 3Q '13 4Q '13 1Q '14 2Q '14 3Q '14 4Q '14 1Q '15 Utica Marcellus GROWTH HIGH GROWTH MIDSTREAM THROUGHPUT Low Pressure Gathering (MMcf/d) Compression (MMcf/d) High Pressure Gathering (MMcf/d) EBITDA ($MM) 6 $155 |
|
|
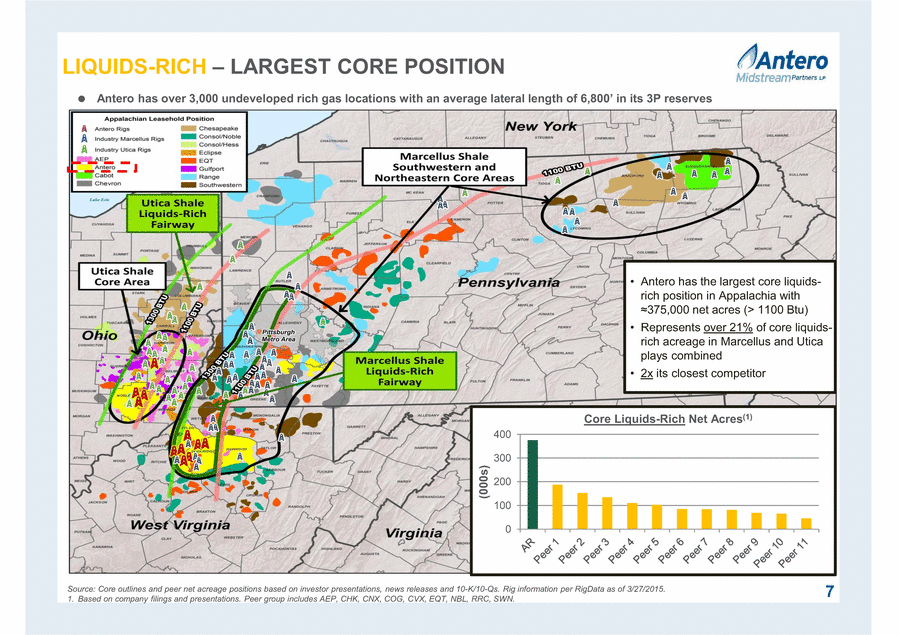
7 LIQUIDS-RICH LARGEST CORE POSITION Source: Core outlines and peer net acreage positions based on investor presentations, news releases and 10-K/10-Qs. Rig information per RigData as of 3/27/2015. 1. Based on company filings and presentations. Peer group includes AEP, CHK, CNX, COG, CVX, EQT, NBL, RRC, SWN. Antero has the largest core liquidsrich position in Appalachia with 375,000 net acres (> 1100 Btu) Represents over 21% of core liquidsrich acreage in Marcellus and Utica plays combined 2x its closest competitor 0 100 200 300 400 (000s) Core Liquids-Rich Net Acres(1) |
|
|
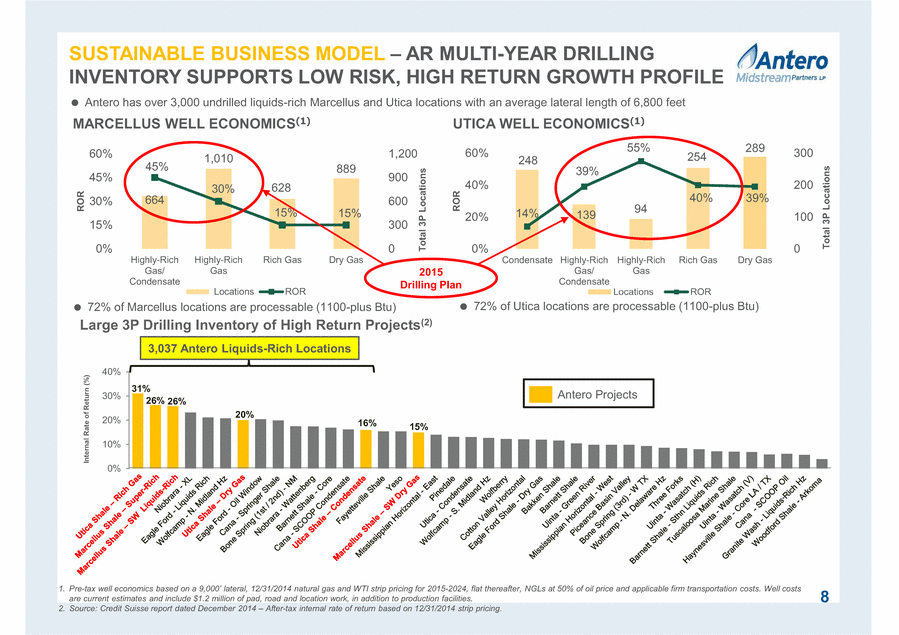
0% 10% 20% 30% 40% 248 139 94 254 289 14% 39% 55% 40% 39% 0 100 200 300 0% 20% 40% 60% Condensate Highly-Rich Gas / Condensate Highly-Rich Gas Rich Gas Dry Gas Total 3P Locations ROR Locations ROR MARCELLUS WELL ECONOMICS(1) 664 1,010 628 889 45% 30% 15% 15% 0 300 600 900 1,200 0% 15% 30% 45% 60% Highly-Rich Gas/ Condensate Highly-Rich Gas Rich Gas Dry Gas Total 3P Locations ROR Locations ROR SUSTAINABLE BUSINESS MODEL AR MULTI-YEAR DRILLING INVENTORY SUPPORTS LOW RISK, HIGH RETURN GROWTH PROFILE Large 3P Drilling Inventory of High Return Projects(2) 1. Pre-strip pricing for 2015-2024, flat thereafter, NGLs at 50% of oil price and applicable firm transportation costs. Well costs are current estimates and include $1.2 million of pad, road and location work, in addition to production facilities. 2. Source: Credit Suisse report dated December 2014 After-tax internal rate of return based on 12/31/2014 strip pricing. 26% 26% 31% 15% Internal Rate of Return (%) 20% 8 UTICA WELL ECONOMICS(1) 72% of Marcellus locations are processable (1100-plus Btu) 72% of Utica locations are processable (1100-plus Btu) 3,037 Antero Liquids-Rich Locations 16% 2015 Drilling Plan Antero Projects Antero has over 3,000 undrilled liquids-rich Marcellus and Utica locations with an average lateral length of 6,800 feet |
|
|
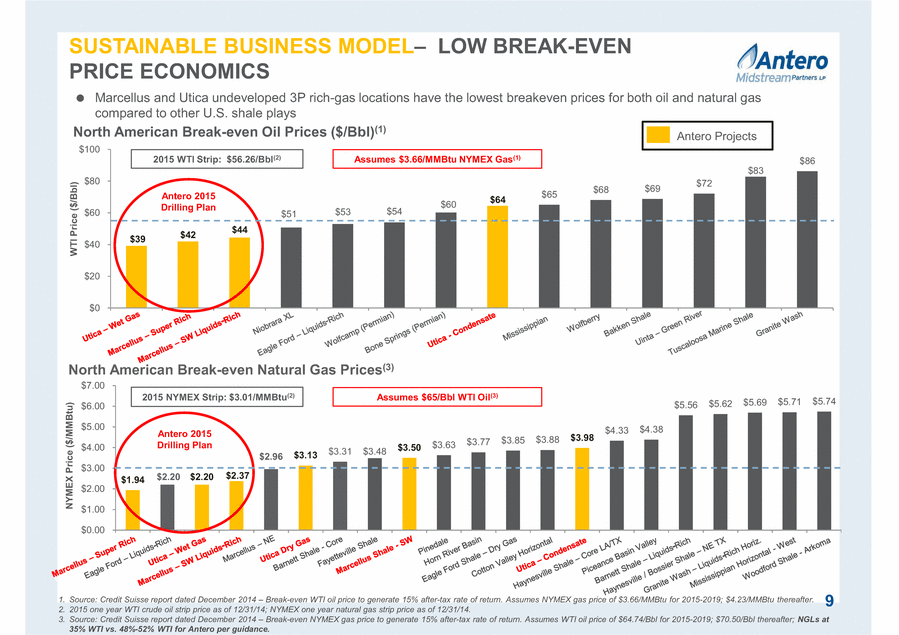
Marcellus and Utica undeveloped 3P rich-gas locations have the lowest breakeven prices for both oil and natural gas compared to other U.S. shale plays $39 $42 $44 $51 $53 $54 $60 $64 $65 $68 $69 $72 $83 $86 $0 $20 $40 $60 $80 $100 WTI Price ($/Bbl) Antero 2015 Drilling Plan 1. Source: Credit Suisse report dated December 2014 Break-even WTI oil price to generate 15% after-tax rate of return. Assumes NYMEX gas price of $3.66/MMBtu for 2015-2019; $4.23/MMBtu thereafter. 2. 2015 one year WTI crude oil strip price as of 12/31/14; NYMEX one year natural gas strip price as of 12/31/14. 3. Source: Credit Suisse report dated December 2014 Break-even NYMEX gas price to generate 15% after-tax rate of return. Assumes WTI oil price of $64.74/Bbl for 2015-2019; $70.50/Bbl thereafter; NGLs at 35% WTI vs. 48%-52% WTI for Antero per guidance. $1.94 $2.20 $2.20 $2.37 $2.96 $3.13 $3.31 $3.48 $3.50 $3.63 $3.77 $3.85 $3.88 $3.98 $4.33 $4.38 $5.56 $5.62 $5.69 $5.71 $5.74 $0.00 $1.00 $2.00 $3.00 $4.00 $5.00 $6.00 $7.00 NYMEX Price ($/MMBtu) Antero 2015 Drilling Plan Assumes $65/Bbl WTI Oil(3) SUSTAINABLE BUSINESS MODEL LOW BREAK-EVEN PRICE ECONOMICS North American Break-even Natural Gas Prices(3) 9 North American Break-even Oil Prices ($/Bbl)(1) 2015 NYMEX Strip: $3.01/MMBtu(2) 2015 WTI Strip: $56.26/Bbl(2) Antero Projects Assumes $3.66/MMBtu NYMEX Gas(1) |
|
|
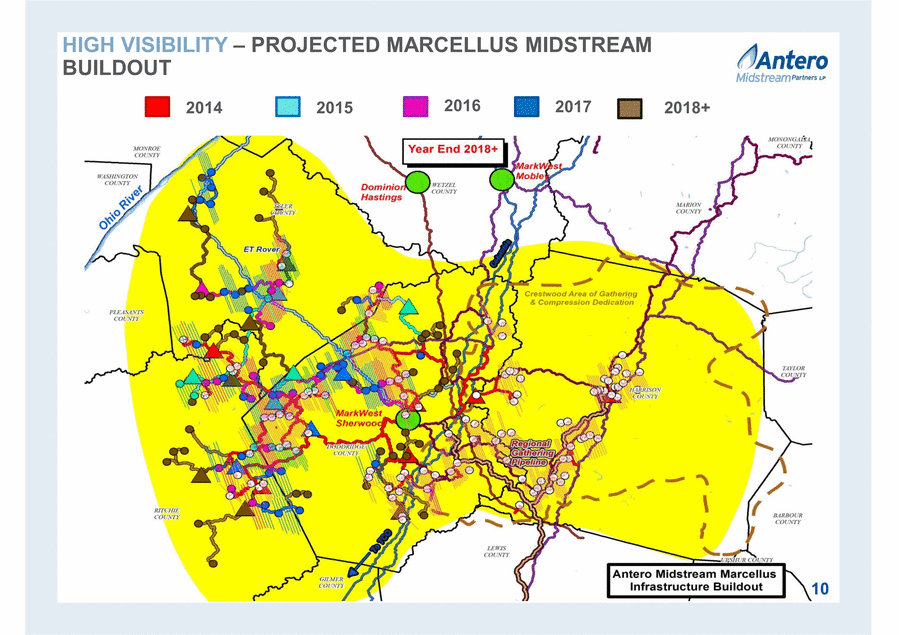
10 HIGH VISIBILITY – PROJECTED MARCELLUS MIDSTREAM BUILDOUT 2014 2015 2016 2017 2018+ |
|
|
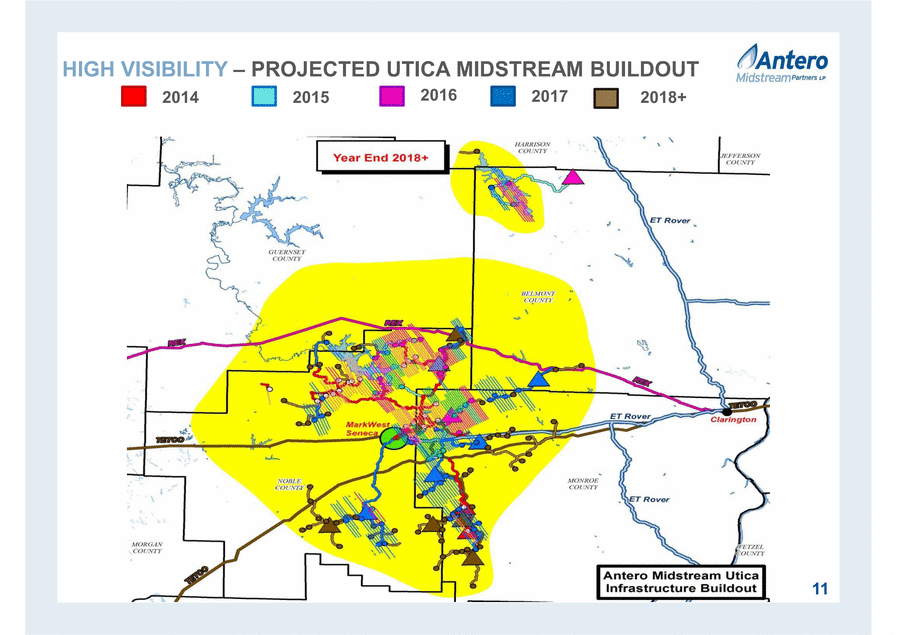
11 HIGH VISIBILITY – PROJECTED UTICA MIDSTREAM BUILDOUT 2014 2015 2016 2017 2018+ |
|
|
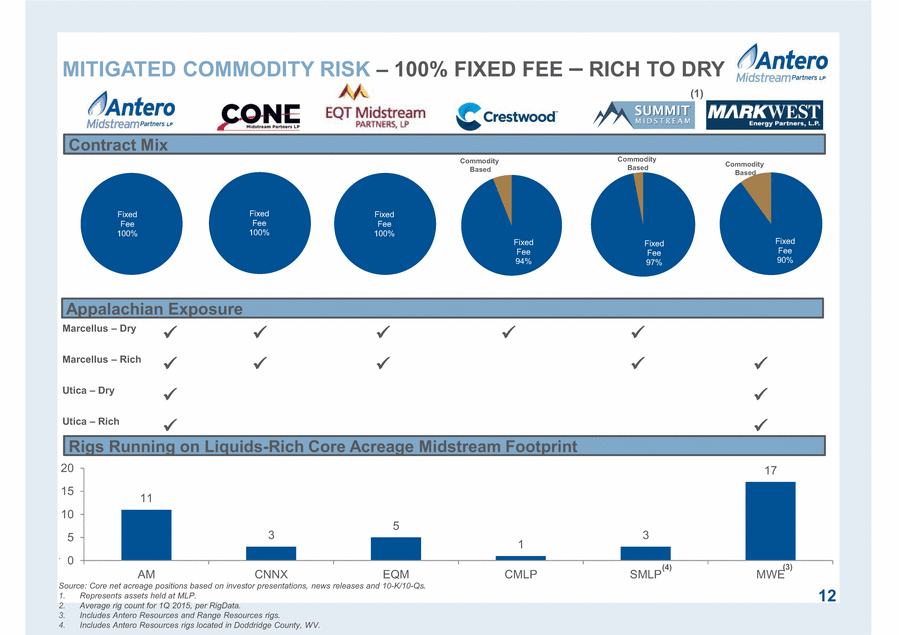
Fixed Fee 100% 12 MITIGATED COMMODITY RISK –100% FIXED FEE – RICH TO DRY Contract Mix Fixed Fee 97% Fixed Fee 100% Fixed Fee 100% Fixed Fee 94% (1) . Source: Core net acreage positions based on investor presentations, news releases and 10-K/10-Qs. 1. Represents assets held at MLP. 2. Average rig count for 1Q 2015, per RigData. 3. Includes Antero Resources and Range Resources rigs. 4. Includes Antero Resources rigs located in Doddridge County, WV. Commodity Based Commodity Based Commodity Based Appalachian Exposure Marcellus – Dry Marcellus – Rich Utica – Dry Utica – Rich Rigs Running on Liquids-Rich Core Acreage Midstream Footprint 11 3 5 1 3 17 0 5 10 15 20 AM CNNX EQM CMLP SMLP MWE (3) Fixed Fee 90% (4) |
|
|
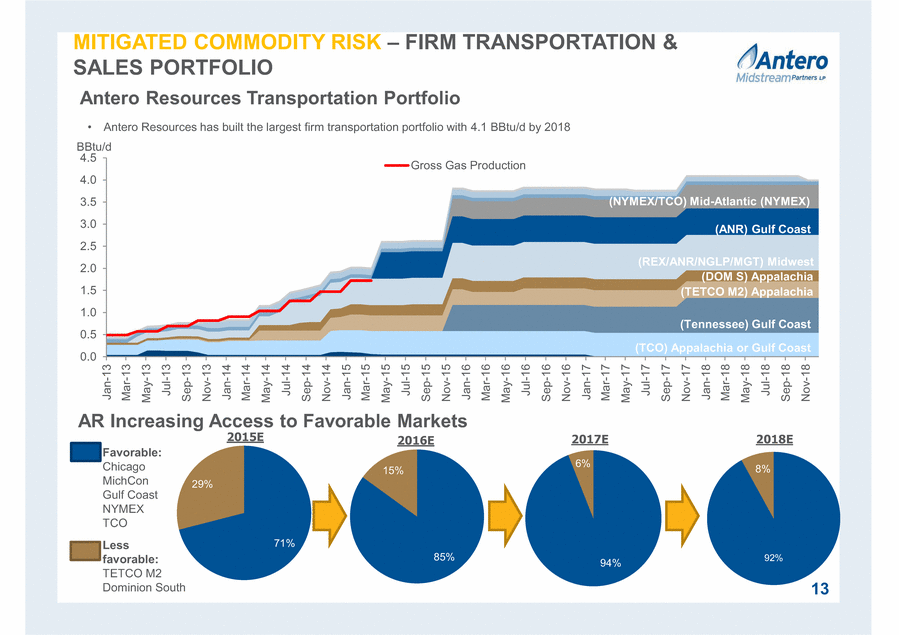
0.0 0.5 1.0 1.5 2.0 2.5 3.0 3.5 4.0 4.5 Jan-13 Mar-13 May-13 Jul-13 Sep-13 Nov-13 Jan-14 Mar-14 May-14 Jul-14 Sep-14 Nov-14 Jan-15 Mar-15 May-15 Jul-15 Sep-15 Nov-15 Jan-16 Mar-16 May-16 Jul-16 Sep-16 Nov-16 Jan-17 Mar-17 May-17 Jul-17 Sep-17 Nov-17 Jan-18 Mar-18 May-18 Jul-18 Sep-18 Nov-18 Gross Gas Production MITIGATED COMMODITY RISK – FIRM TRANSPORTATION & SALES PORTFOLIO 13 BBtu/d Antero Resources Transportation Portfolio Antero Resources has built the largest firm transportation portfolio with 4.1 BBtu/d by 2018 71% 29% 85% 15% 94% 6% 2015E 2016E 2017E 2018E Favorable: Chicago MichCon Gulf Coast NYMEX TCO AR Increasing Access to Favorable Markets 92% 8% (NYMEX/TCO) Mid-Atlantic (NYMEX) (ANR) Gulf Coast (REX/ANR/NGLP/MGT) Midwest (DOM S) Appalachia (TETCO M2) Appalachia (Tennessee) Gulf Coast (TCO) Appalachia or Gulf Coast Less favorable: TETCO M2 Dominion South |
|
|
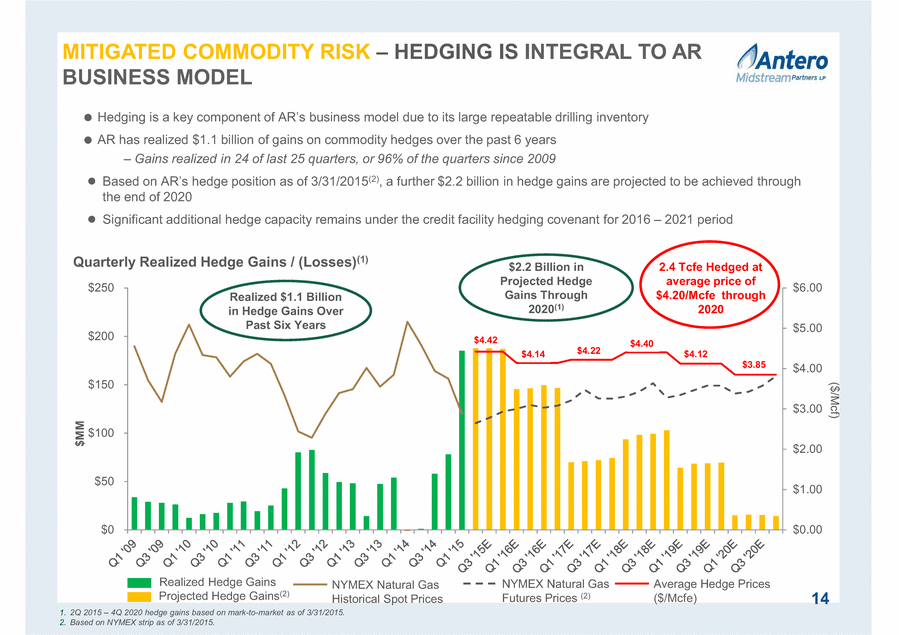
$0.00 $1.00 $2.00 $3.00 $4.00 $5.00 $6.00 $0 $50 $100 $150 $200 $250 $MM 14 MITIGATED COMMODITY RISK – HEDGING IS INTEGRAL TO AR BUSINESS MODEL 1. 2Q 2015 – 4Q 2020 hedge gains based on mark-to-market as of 3/31/2015. 2. Based on NYMEX strip as of 3/31/2015. AR has realized $1.1 billion of gains on commodity hedges over the past 6 years Gains realized in 24 of last 25 quarters, or 96% of the quarters since 2009 (2), a further $2.2 billion in hedge gains are projected to be achieved through the end of 2020 Significant additional hedge capacity remains under the credit facility hedging covenant for 2016 Hedging is a key component of AR’s business model due to its large repeatable drilling inventory 2021 period Quarterly Realized Hedge Gains / (Losses)(1) Realized Hedge Gains Projected Hedge Gains(2) NYMEX Natural Gas Historical Spot Prices ($/Mcf) NYMEX Natural Gas Futures Prices (2) 2.4 Tcfe Hedged at average price of $4.20/Mcfe through 2020 $4.42 $4.14 $4.22 $4.40 $4.12 $3.85 Realized $1.1 Billion in Hedge Gains Over Past Six Years $2.2 Billion in Projected Hedge Gains Through 2020(1) Average Hedge Prices ($/Mcfe) Based on AR’s hedge position as of 3/31/2015( |
|
|
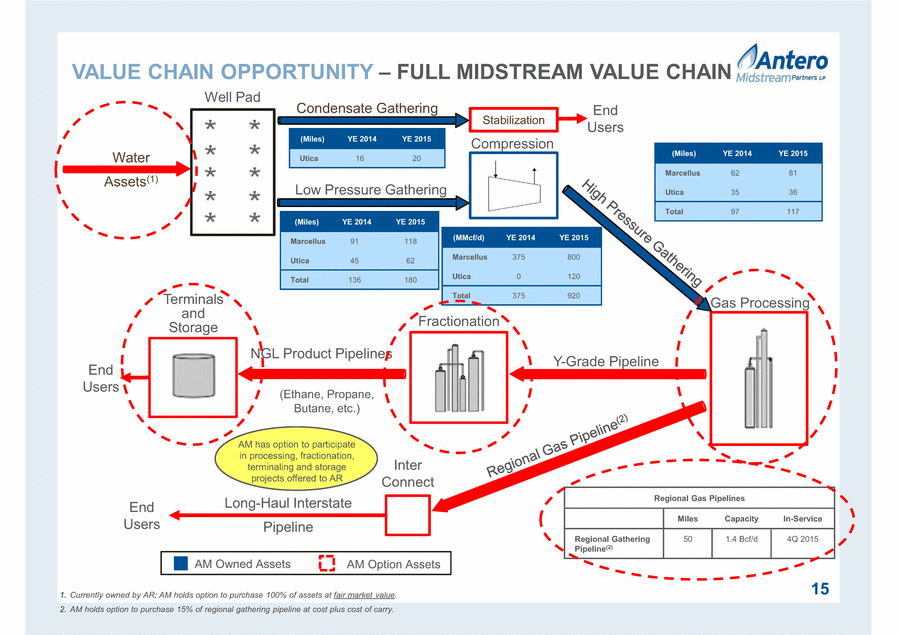
Water Assets(1) Regional Gas Pipelines Miles Capacity In-Service Regional Gathering Pipeline(2) 50 1.4 Bcf/d 4Q 2015 15 1. Currently owned by AR; AM holds option to purchase 100% of assets at fair market value. 2. AM holds option to purchase 15% of regional gathering pipeline at cost plus cost of carry. End Users End Users Gas Processing Y-Grade Pipeline Long-Haul Interstate Pipeline Inter Connect NGL Product Pipelines Fractionation Compression Low Pressure Gathering Well Pad Terminals and Storage (Miles) YE 2014 YE 2015 Marcellus 91 118 Utica 45 62 Total 136 180 AM has option to participate in processing, fractionation, terminaling and storage projects offered to AR VALUE CHAIN OPPORTUNITY FULL MIDSTREAM VALUE CHAIN (Miles) YE 2014 YE 2015 Marcellus 62 81 Utica 35 36 Total 97 117 (MMcf/d) YE 2014 YE 2015 Marcellus 375 800 Utica 0 120 Total 375 920 AM Owned Assets Condensate Gathering Stabilization (Miles) YE 2014 YE 2015 Utica 16 20 End Users AM Option Assets (Ethane, Propane, Butane, etc.) Regional Gas Pipelines |
|
|
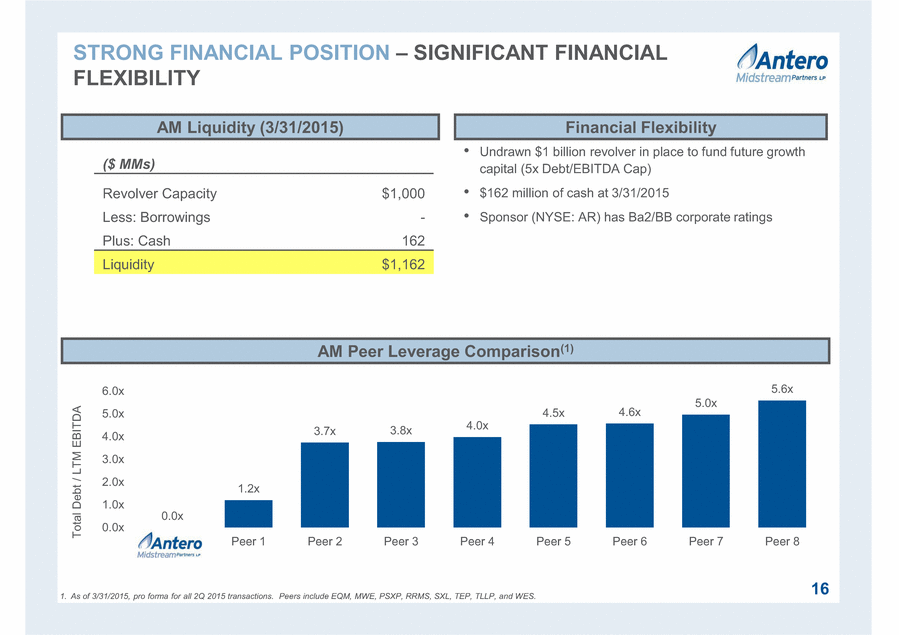
0.0x 1.2x 3.7x 3.8x 4.0x 4.5x 4.6x 5.0x 5.6x 0.0x 1.0x 2.0x 3.0x 4.0x 5.0x 6.0x AM Peer 1 Peer 2 Peer 3 Peer 4 Peer 5 Peer 6 Peer 7 Peer 8 Total Debt / LTM EBITDA STRONG FINANCIAL POSITION SIGNIFICANT FINANCIAL FLEXIBILITY 16 Undrawn $1 billion revolver in place to fund future growth capital (5x Debt/EBITDA Cap) $162 million of cash at 3/31/2015 Sponsor (NYSE: AR) has Ba2/BB corporate ratings AM Liquidity (3/31/2015) AM Peer Leverage Comparison(1) ($ MMs) Revolver Capacity $1,000 Less: Borrowings - Plus: Cash 162 Liquidity $1,162 1. As of 3/31/2015, pro forma for all 2Q 2015 transactions. Peers include EQM, MWE, PSXP, RRMS, SXL, TEP, TLLP, and WES. Financial Flexibility |
|
|
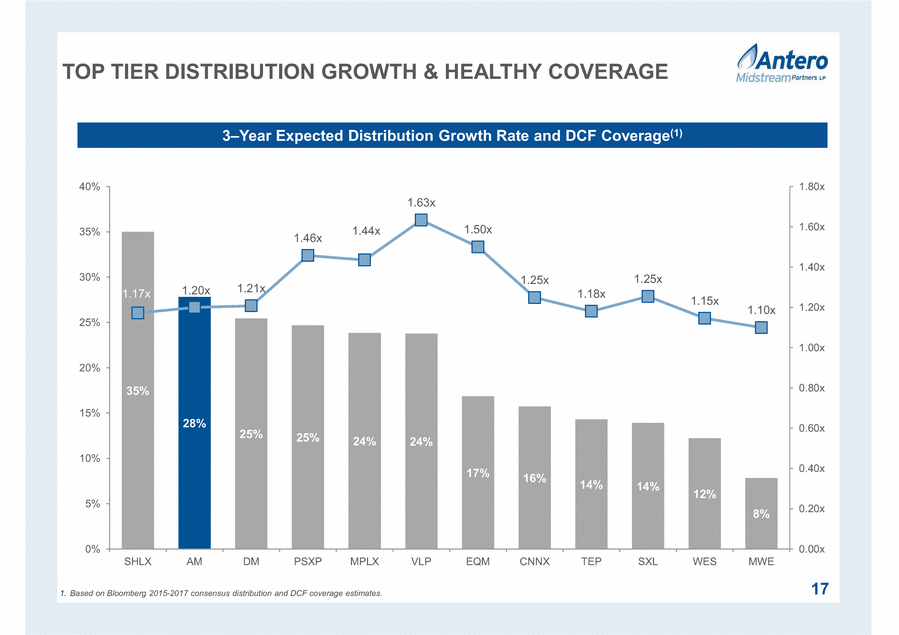
3Year Expected Distribution Growth Rate and DCF Coverage(1) 17 1. Based on Bloomberg 2015-2017 consensus distribution and DCF coverage estimates. TOP TIER DISTRIBUTION GROWTH & HEALTHY COVERAGE 35% 28% 25% 25% 24% 24% 17% 16% 14% 14% 12% 8% 1.17x 1.20x 1.21x 1.46x 1.44x 1.63x 1.50x 1.25x 1.18x 1.25x 1.15x 1.10x 0.00x 0.20x 0.40x 0.60x 0.80x 1.00x 1.20x 1.40x 1.60x 1.80x 0% 5% 10% 15% 20% 25% 30% 35% 40% SHLX AM DM PSXP MPLX VLP EQM CNNX TEP SXL WES MWE |
|
|
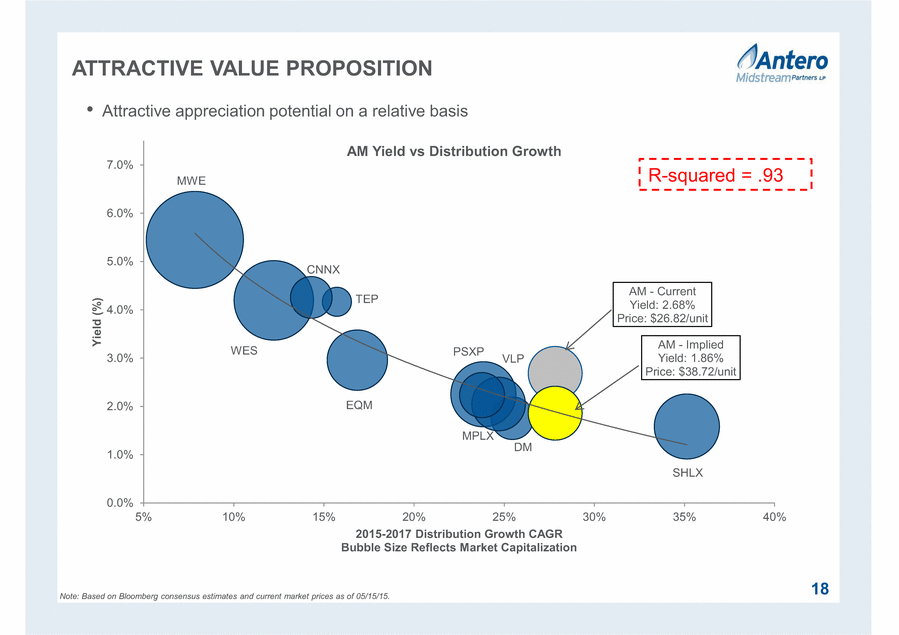
ATTRACTIVE VALUE PROPOSITION Note: Based on Bloomberg consensus estimates and current market prices as of 05/15/15. 18 Attractive appreciation potential on a relative basis EQM DM SHLX CNNX MWE WES TEP MPLX PSXP VLP AM - Current Yield: 2.68% Price: $26.82/unit AM - Implied Yield: 1.86% Price: $38.72/unit 0.0% 1.0% 2.0% 3.0% 4.0% 5.0% 6.0% 7.0% 5% 10% 15% 20% 25% 30% 35% 40% Yield (%) 2015-2017 Distribution Growth CAGR Bubble Size Reflects Market Capitalization AM Yield vs Distribution Growth R-squared = .93 |
|
|
Antero Midstream (NYSE: AM) Asset Overview 19 |
|
|
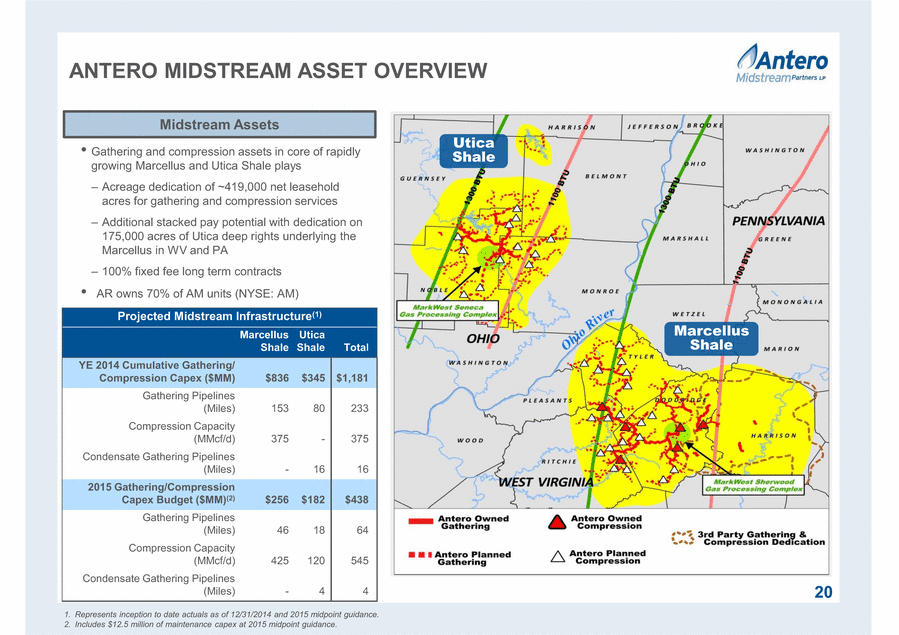
1. Represents inception to date actuals as of 12/31/2014 and 2015 midpoint guidance. 2. Includes $12.5 million of maintenance capex at 2015 midpoint guidance. 20 Utica Shale Marcellus Shale Projected Midstream Infrastructure(1) Marcellus Shale Utica Shale Total YE 2014 Cumulative Gathering/ Compression Capex ($MM) $836 $345 $1,181 Gathering Pipelines (Miles) 153 80 233 Compression Capacity (MMcf/d) 375 - 375 Condensate Gathering Pipelines (Miles) - 16 16 2015 Gathering/Compression Capex Budget ($MM)(2) $256 $182 $438 Gathering Pipelines (Miles) 46 18 64 Compression Capacity (MMcf/d) 425 120 545 Condensate Gathering Pipelines (Miles) - 4 4 Midstream Assets ANTERO MIDSTREAM ASSET OVERVIEW Gathering and compression assets in core of rapidly growing Marcellus and Utica Shale plays Acreage dedication of ~419,000 net leasehold acres for gathering and compression services Additional stacked pay potential with dedication on 175,000 acres of Utica deep rights underlying the Marcellus in WV and PA 100% fixed fee long term contracts AR owns 70% of AM units (NYSE: AM) |
|
|
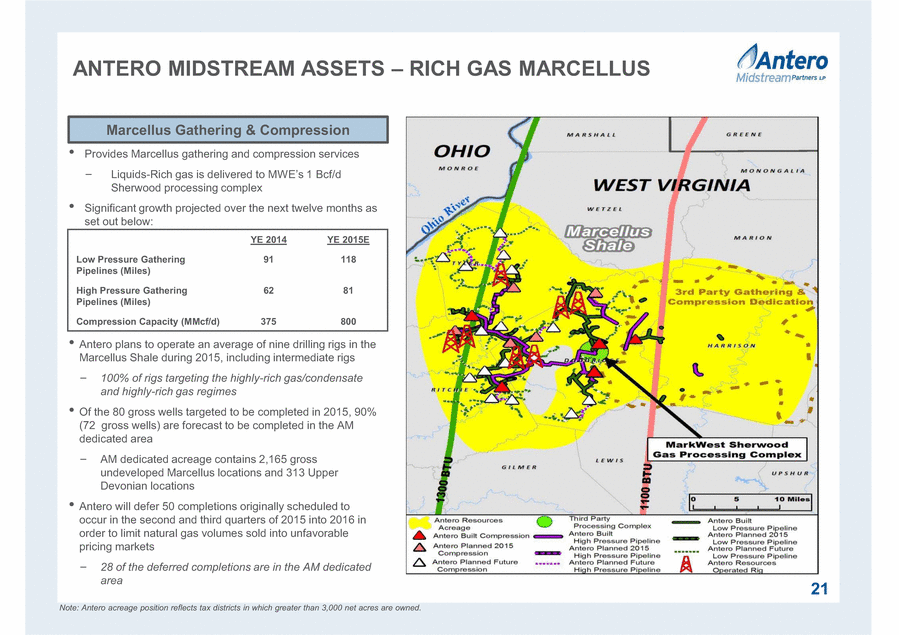
ANTERO MIDSTREAM ASSETS RICH GAS MARCELLUS 21 Provides Marcellus gathering and compression services Liquids-Rich gas is delivered to MWE’s 1 Bcf/d Sherwood processing complex Significant growth projected over the next twelve months as set out below: Antero plans to operate an average of nine drilling rigs in the Marcellus Shale during 2015, including intermediate rigs 100% of rigs targeting the highly-rich gas/condensate and highly-rich gas regimes Of the 80 gross wells targeted to be completed in 2015, 90% (72 gross wells) are forecast to be completed in the AM dedicated area AM dedicated acreage contains 2,165 gross undeveloped Marcellus locations and 313 Upper Devonian locations Antero will defer 50 completions originally scheduled to occur in the second and third quarters of 2015 into 2016 in order to limit natural gas volumes sold into unfavorable pricing markets 28 of the deferred completions are in the AM dedicated area Marcellus Gathering & Compression Note: Antero acreage position reflects tax districts in which greater than 3,000 net acres are owned. YE 2014 YE 2015E Low Pressure Gathering Pipelines (Miles) 91 118 High Pressure Gathering Pipelines (Miles) 62 81 Compression Capacity (MMcf/d) 375 800 |
|
|
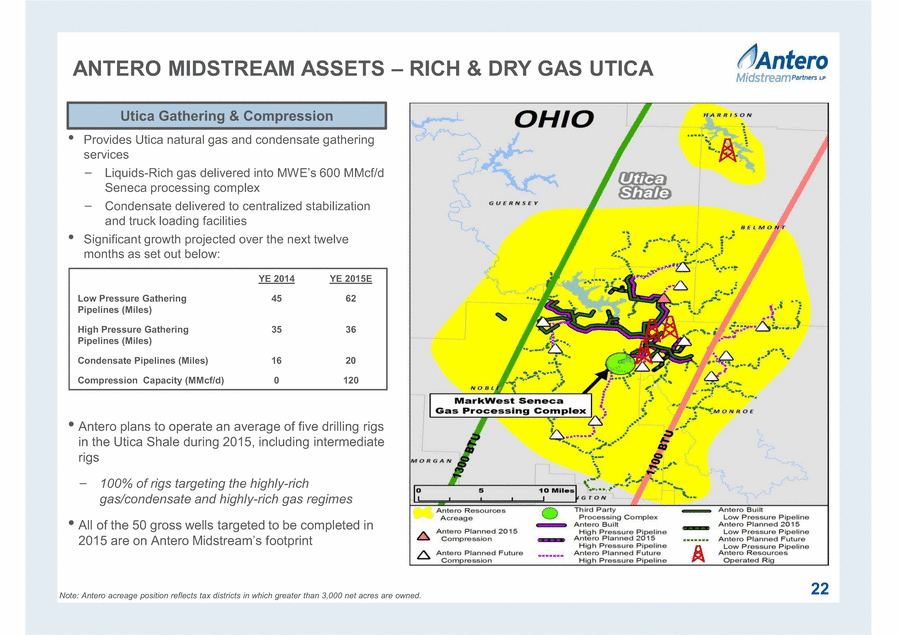
22 Provides Utica natural gas and condensate gathering services Liquids-Rich gas delivered into MWE’s 600 MMcf/d Seneca processing complex Condensate delivered to centralized stabilization and truck loading facilities Significant growth projected over the next twelve months as set out below: Antero plans to operate an average of five drilling rigs in the Utica Shale during 2015, including intermediate rigs 100% of rigs targeting the highly-rich gas/condensate and highly-rich gas regimes All of the 50 gross wells targeted to be completed in footprint Utica Gathering & Compression Note: Antero acreage position reflects tax districts in which greater than 3,000 net acres are owned. ANTERO MIDSTREAM ASSETS RICH & DRY GAS UTICA YE 2014 YE 2015E Low Pressure Gathering Pipelines (Miles) 45 62 High Pressure Gathering Pipelines (Miles) 35 36 Condensate Pipelines (Miles) 16 20 Compression Capacity (MMcf/d) 0 120 |
|
|
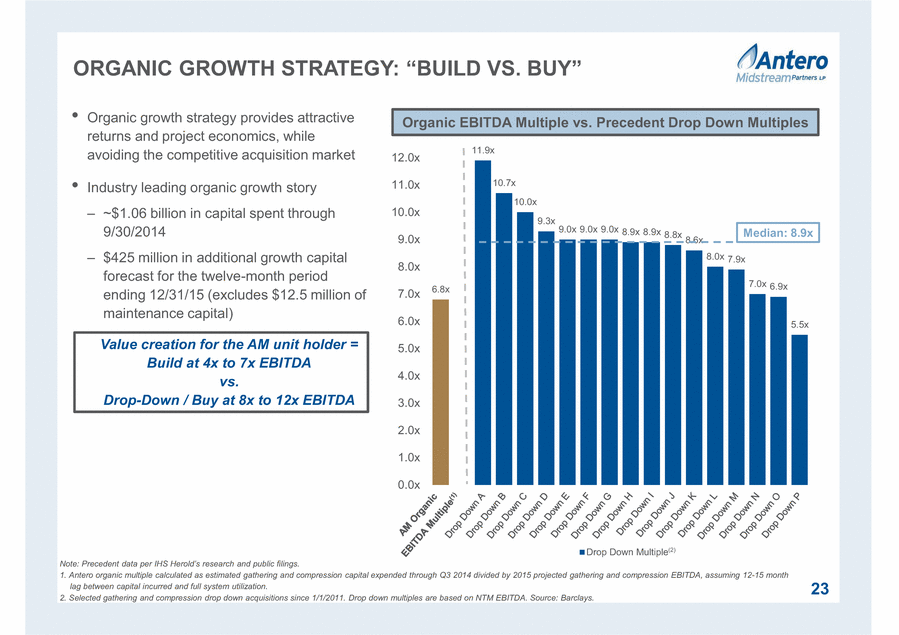
23 Organic growth strategy provides attractive returns and project economics, while avoiding the competitive acquisition market Industry leading organic growth story ~$1.06 billion in capital spent through 9/30/2014 $425 million in additional growth capital forecast for the twelve-month period ending 12/31/15 (excludes $12.5 million of maintenance capital) 1. Antero organic multiple calculated as estimated gathering and compression capital expended through Q3 2014 divided by 2015 projected gathering and compression EBITDA, assuming 12-15 month lag between capital incurred and full system utilization. 2. Selected gathering and compression drop down acquisitions since 1/1/2011. Drop down multiples are based on NTM EBITDA. Source: Barclays. 6.8x 11.9x 10.7x 10.0x 9.3x 9.0x 9.0x 9.0x 8.9x 8.9x 8.8x 8.6x 8.0x 7.9x 7.0x 6.9x 5.5x 0.0x 1.0x 2.0x 3.0x 4.0x 5.0x 6.0x 7.0x 8.0x 9.0x 10.0x 11.0x 12.0x Drop Down Multiple(2) Organic EBITDA Multiple vs. Precedent Drop Down Multiples Median: 8.9x Value creation for the AM unit holder = Build at 4x to 7x EBITDA vs. Drop-Down / Buy at 8x to 12x EBITDA Note: Precedent data per IHS Herold’s research and public filings. |
|
|
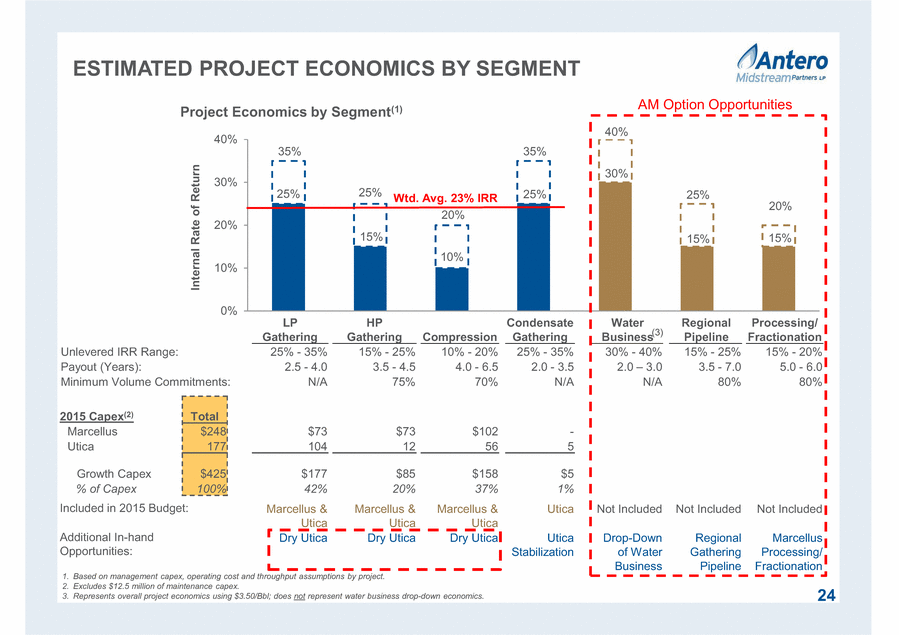
LP Gathering HP Gathering Compression Condensate Gathering Water Business Regional Pipeline Processing/ Fractionation Unlevered IRR Range: 25% - 35% 15% - 25% 10% - 20% 25% - 35% 30% - 40% 15% - 25% 15% - 20% Payout (Years): 2.5 - 4.0 3.5 - 4.5 4.0 - 6.5 2.0 - 3.5 2.0 3.0 3.5 - 7.0 5.0 - 6.0 Minimum Volume Commitments: N/A 75% 70% N/A N/A 80% 80% 2015 Capex(2) Total Marcellus $248 $73 $73 $102 - Utica 177 104 12 56 5 Growth Capex $425 $177 $85 $158 $5 % of Capex 100% 42% 20% 37% 1% Included in 2015 Budget: Marcellus & Utica Marcellus & Utica Marcellus & Utica Utica Not Included Not Included Not Included Additional In-hand Opportunities: Dry Utica Dry Utica Dry Utica Utica Stabilization Drop-Down of Water Business Regional Gathering Pipeline Marcellus Processing/ Fractionation 25% 15% 10% 25% 30% 15% 15% 35% 25% 20% 35% 25% 20% 40% 0% 10% 20% 30% 40% Internal Rate of Return 24 Project Economics by Segment(1) ESTIMATED PROJECT ECONOMICS BY SEGMENT 1. Based on management capex, operating cost and throughput assumptions by project. 2. Excludes $12.5 million of maintenance capex. 3. Represents overall project economics using $3.50/Bbl; does not represent water business drop-down economics. Wtd. Avg. 23% IRR AM Option Opportunities (3) |
|
|
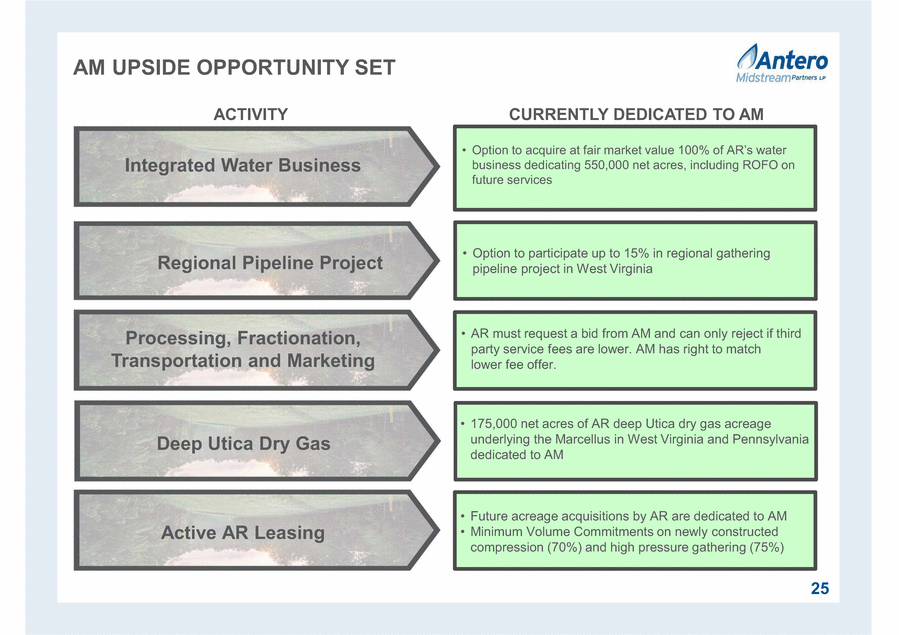
AM UPSIDE OPPORTUNITY SET 25 ACTIVITY CURRENTLY DEDICATED TO AM Integrated Water Business Processing, Fractionation, Transportation and Marketing Regional Pipeline Project Option to participate up to 15% in regional gathering pipeline project in West Virginia Option to acquire at fair market value 100% of AR’s water business dedicating 550,000 net acres, including ROFO on future services AR must request a bid from AM and can only reject if third party service fees are lower. AM has right to match lower fee offer. Deep Utica Dry Gas 175,000 net acres of AR deep Utica dry gas acreage underlying the Marcellus in West Virginia and Pennsylvania dedicated to AM Active AR Leasing Future acreage acquisitions by AR are dedicated to AM Minimum Volume Commitments on newly constructed compression (70%) and high pressure gathering (75%) |
|
|
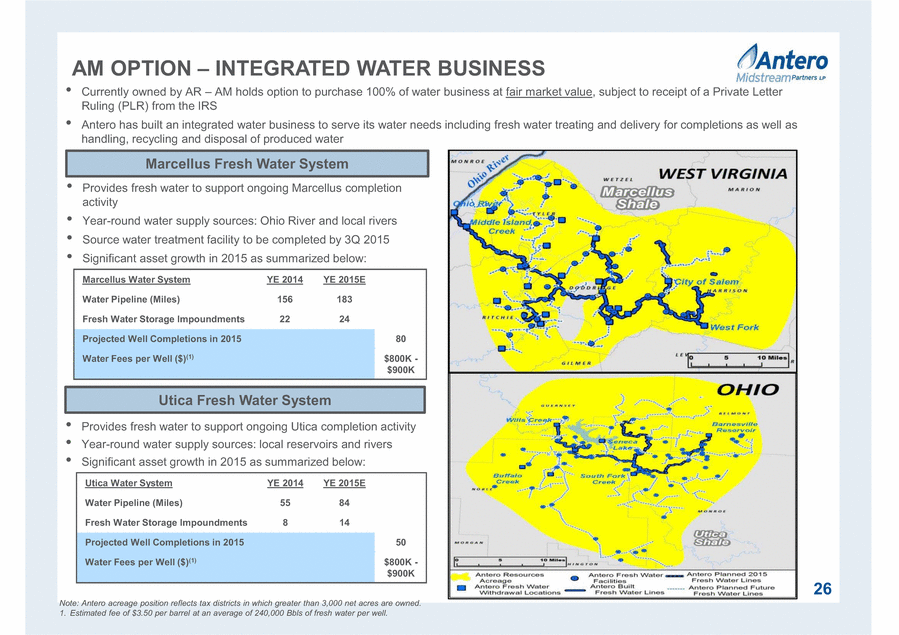
AM OPTION INTEGRATED WATER BUSINESS 26 Marcellus Fresh Water System Provides fresh water to support ongoing Marcellus completion activity Year-round water supply sources: Ohio River and local rivers Source water treatment facility to be completed by 3Q 2015 Significant asset growth in 2015 as summarized below: Note: Antero acreage position reflects tax districts in which greater than 3,000 net acres are owned. 1. Estimated fee of $3.50 per barrel at an average of 240,000 Bbls of fresh water per well. Utica Fresh Water System Provides fresh water to support ongoing Utica completion activity Year-round water supply sources: local reservoirs and rivers Significant asset growth in 2015 as summarized below: Currently owned by AR AM holds option to purchase 100% of water business at fair market value, subject to receipt of a Private Letter Ruling (PLR) from the IRS Antero has built an integrated water business to serve its water needs including fresh water treating and delivery for completions as well as handling, recycling and disposal of produced water Marcellus Water System YE 2014 YE 2015E Water Pipeline (Miles) 156 183 Fresh Water Storage Impoundments 22 24 Projected Well Completions in 2015 80 Water Fees per Well ($)(1) $800K - $900K Utica Water System YE 2014 YE 2015E Water Pipeline (Miles) 55 84 Fresh Water Storage Impoundments 8 14 Projected Well Completions in 2015 50 Water Fees per Well ($)(1) $800K - $900K |
|
|
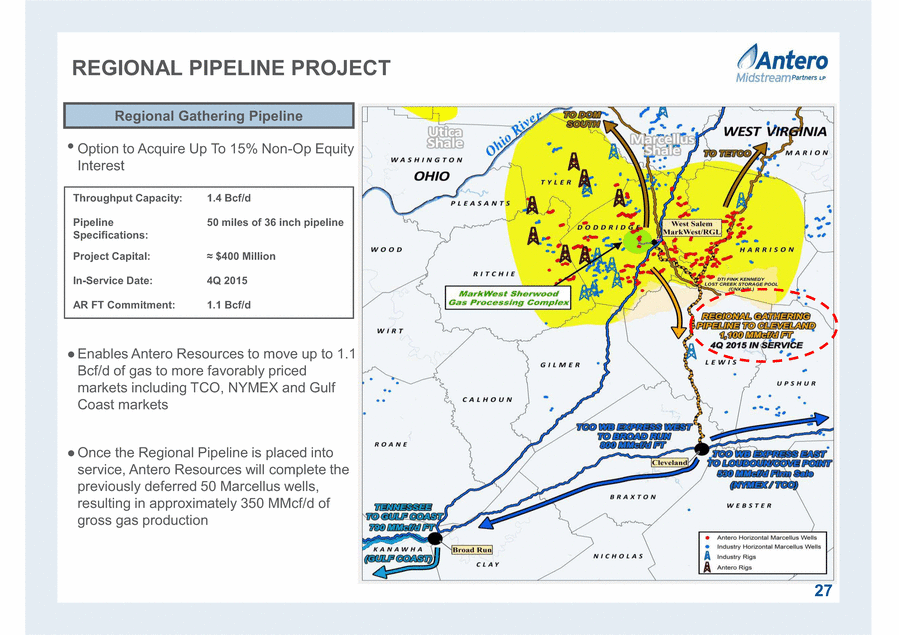
REGIONAL PIPELINE PROJECT Option to Acquire Up To 15% Non-Op Equity Interest Enables Antero Resources to move up to 1.1 Bcf/d of gas to more favorably priced markets including TCO, NYMEX and Gulf Coast markets Once the Regional Pipeline is placed into service, Antero Resources will complete the previously deferred 50 Marcellus wells, resulting in approximately 350 MMcf/d of gross gas production Regional Gathering Pipeline Throughput Capacity: 1.4 Bcf/d Pipeline Specifications: 50 miles of 36 inch pipeline Project Capital: Million In-Service Date: 4Q 2015 AR FT Commitment: 1.1 Bcf/d 27 |
|
|
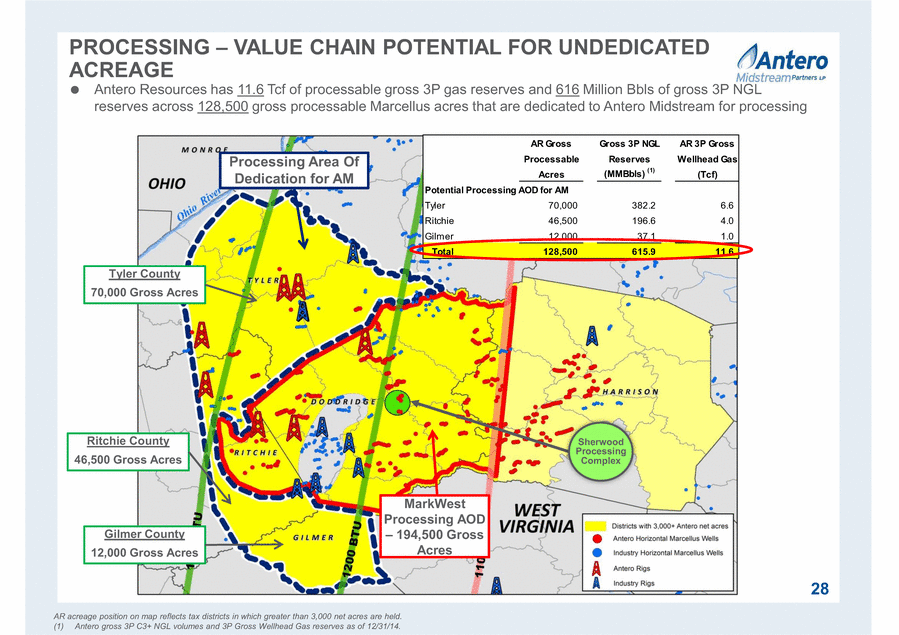
PROCESSING VALUE CHAIN POTENTIAL FOR UNDEDICATED ACREAGE Sherwood Processing Complex AR acreage position on map reflects tax districts in which greater than 3,000 net acres are held. (1) Antero gross 3P C3+ NGL volumes and 3P Gross Wellhead Gas reserves as of 12/31/14. Processing Area Of Dedication for AM MarkWest Processing AOD 194,500 Gross Acres Tyler County 70,000 Gross Acres Ritchie County 46,500 Gross Acres Antero Resources has 11.6 Tcf of processable gross 3P gas reserves and 616 Million Bbls of gross 3P NGL reserves across 128,500 gross processable Marcellus acres that are dedicated to Antero Midstream for processing 28 Gilmer County 12,000 Gross Acres AR Gross Gross 3P NGL AR 3P Gross Processable Reserves Wellhead Gas Acres (MMBbls) (1) (Tcf) Potential Processing AOD for AM Tyler 70,000 382.2 6.6 Ritchie 46,500 196.6 4.0 Gilmer 12,000 37.1 1.0 Total 128,500 615.9 11.6 |
|
|
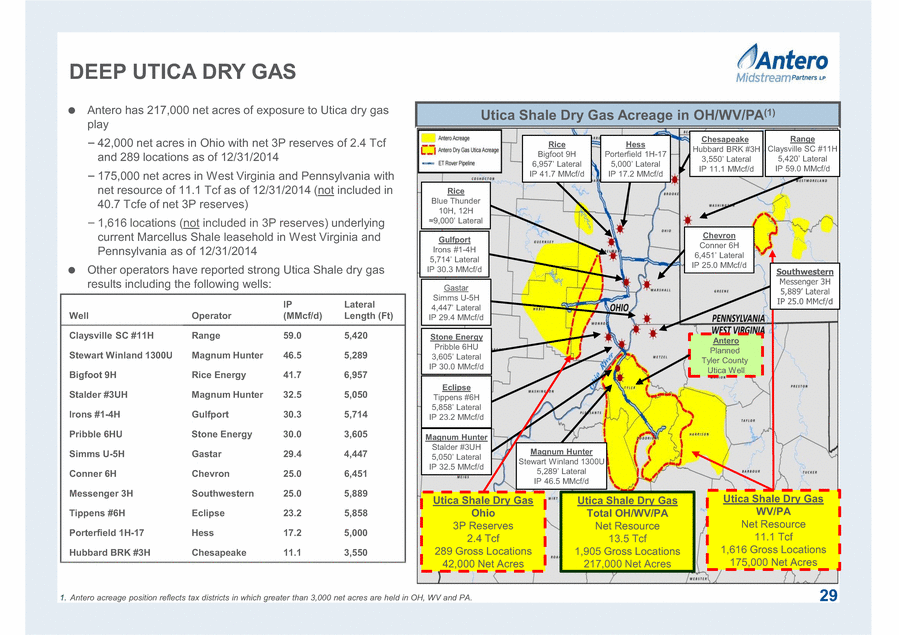
DEEP UTICA DRY GAS 29 Antero has 217,000 net acres of exposure to Utica dry gas play 42,000 net acres in Ohio with net 3P reserves of 2.4 Tcf and 289 locations as of 12/31/2014 175,000 net acres in West Virginia and Pennsylvania with net resource of 11.1 Tcf as of 12/31/2014 (not included in 40.7 Tcfe of net 3P reserves) 1,616 locations (not included in 3P reserves) underlying current Marcellus Shale leasehold in West Virginia and Pennsylvania as of 12/31/2014 Other operators have reported strong Utica Shale dry gas results including the following wells: Well Operator IP (MMcf/d) Lateral Length (Ft) Claysville SC #11H Range 59.0 5,420 Stewart Winland 1300U Magnum Hunter 46.5 5,289 Bigfoot 9H Rice Energy 41.7 6,957 Stalder #3UH Magnum Hunter 32.5 5,050 Irons #1-4H Gulfport 30.3 5,714 Pribble 6HU Stone Energy 30.0 3,605 Simms U-5H Gastar 29.4 4,447 Conner 6H Chevron 25.0 6,451 Messenger 3H Southwestern 25.0 5,889 Tippens #6H Eclipse 23.2 5,858 Porterfield 1H-17 Hess 17.2 5,000 Hubbard BRK #3H Chesapeake 11.1 3,550 1. Antero acreage position reflects tax districts in which greater than 3,000 net acres are held in OH, WV and PA. Utica Shale Dry Gas Acreage in OH/WV/PA(1) Chesapeake Hubbard BRK #3H IP 11.1 MMcf/d Hess Porterfield 1H-17 IP 17.2 MMcf/d Gulfport Irons #1-4H IP 30.3 MMcf/d Eclipse Tippens #6H IP 23.2 MMcf/d Magnum Hunter Stalder #3UH IP 32.5 MMcf/d Antero Planned Tyler County Utica Well Magnum Hunter Stewart Winland 1300U IP 46.5 MMcf/d Range Claysville SC #11H IP 59.0 MMcf/d Chevron Conner 6H IP 25.0 MMcf/d Gastar Simms U-5H IP 29.4 MMcf/d Rice Bigfoot 9H IP 41.7 MMcf/d Utica Shale Dry Gas WV/PA Net Resource 11.1 Tcf 1,616 Gross Locations 175,000 Net Acres Utica Shale Dry Gas Ohio 3P Reserves 2.4 Tcf 289 Gross Locations 42,000 Net Acres Utica Shale Dry Gas Total OH/WV/PA Net Resource 13.5 Tcf 1,905 Gross Locations 217,000 Net Acres Stone Energy Pribble 6HU IP 30.0 MMcf/d Southwestern Messenger 3H Lateral IP 25.0 MMcf/d Rice Blue Thunder 10H, 12H |
|
|
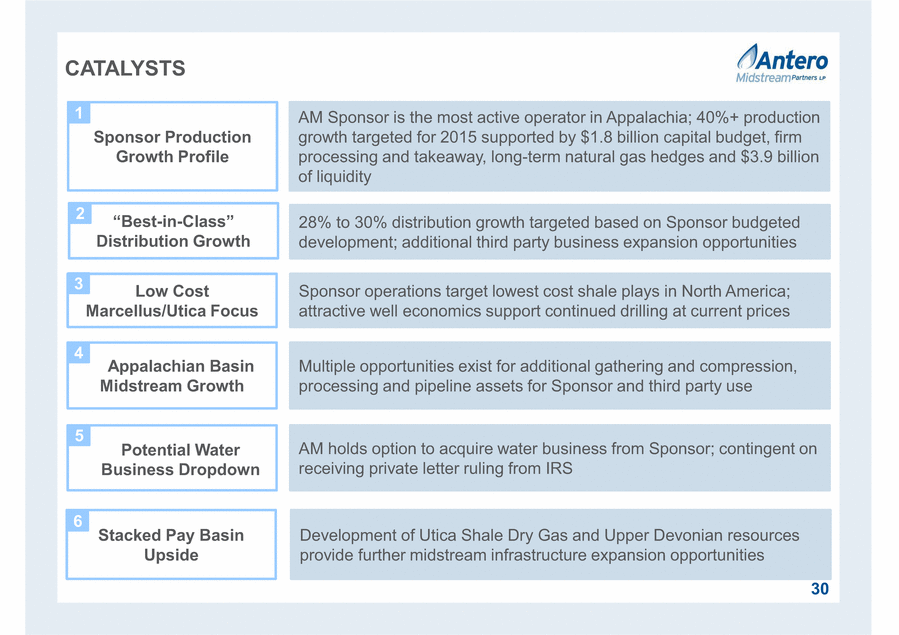
Low Cost Marcellus/Utica Focus -in- Distribution Growth 30 CATALYSTS 28% to 30% distribution growth targeted based on Sponsor budgeted development; additional third party business expansion opportunities AM Sponsor is the most active operator in Appalachia; 40%+ production growth targeted for 2015 supported by $1.8 billion capital budget, firm processing and takeaway, long-term natural gas hedges and $3.9 billion of liquidity Sponsor operations target lowest cost shale plays in North America; attractive well economics support continued drilling at current prices Multiple opportunities exist for additional gathering and compression, processing and pipeline assets for Sponsor and third party use Appalachian Basin Midstream Growth Sponsor Production Growth Profile 1 2 3 4 5 6 AM holds option to acquire water business from Sponsor; contingent on receiving private letter ruling from IRS Stacked Pay Basin Upside Development of Utica Shale Dry Gas and Upper Devonian resources provide further midstream infrastructure expansion opportunities Potential Water Business Dropdown “Best-in-Class” Distribution Growth |
|
|
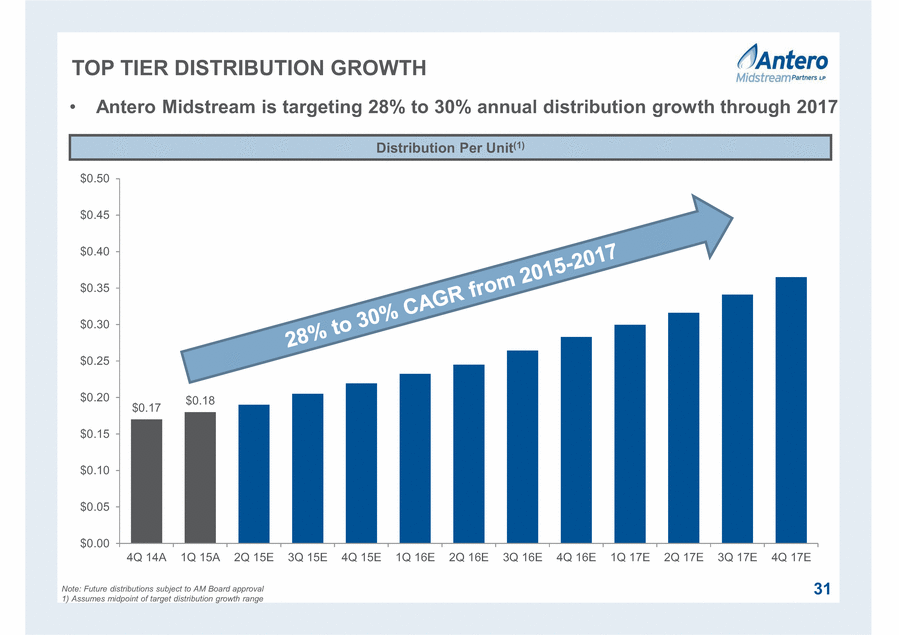
$0.17 $0.18 $0.00 $0.05 $0.10 $0.15 $0.20 $0.25 $0.30 $0.35 $0.40 $0.45 $0.50 4Q 14A 1Q 15A 2Q 15E 3Q 15E 4Q 15E 1Q 16E 2Q 16E 3Q 16E 4Q 16E 1Q 17E 2Q 17E 3Q 17E 4Q 17E TOP TIER DISTRIBUTION GROWTH 31 Distribution Per Unit(1) Antero Midstream is targeting 28% to 30% annual distribution growth through 2017 Note: Future distributions subject to AM Board approval 1) Assumes midpoint of target distribution growth range |
|
|
APPENDIX 32 |
|
|
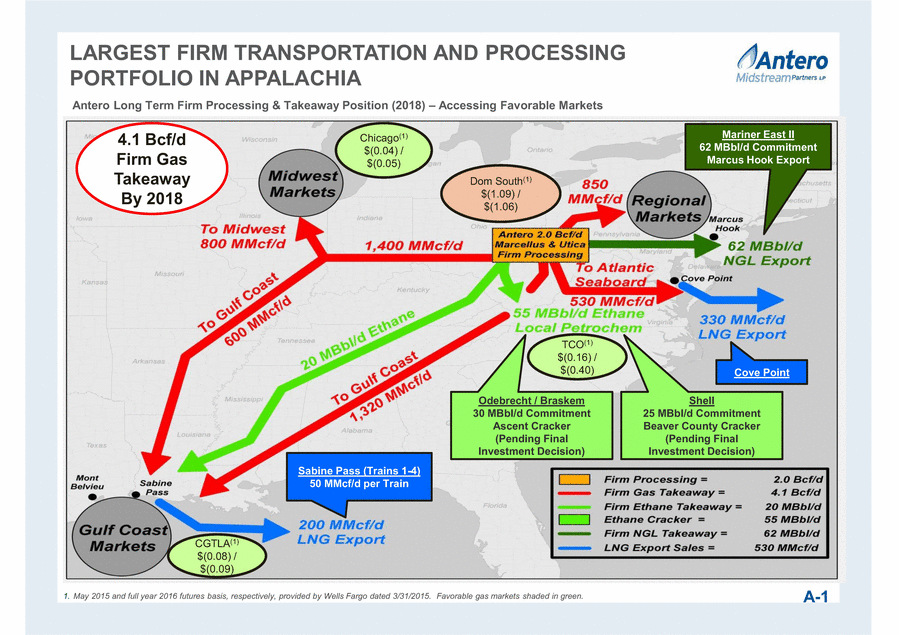
LARGEST FIRM TRANSPORTATION AND PROCESSING PORTFOLIO IN APPALACHIA Odebrecht / Braskem 30 MBbl/d Commitment Ascent Cracker (Pending Final Investment Decision) Antero Long Term Firm Processing & Takeaway Position (2018) Accessing Favorable Markets Mariner East II 62 MBbl/d Commitment Marcus Hook Export Shell 25 MBbl/d Commitment Beaver County Cracker (Pending Final Investment Decision) Sabine Pass (Trains 1-4) 50 MMcf/d per Train 1. May 2015 and full year 2016 futures basis, respectively, provided by Wells Fargo dated 3/31/2015. Favorable gas markets shaded in green. Chicago(1) $(0.04) / $(0.05) CGTLA(1) $(0.08) / $(0.09) Dom South(1) $(1.09) / $(1.06) TCO(1) $(0.16) / $(0.40) A-1 4.1 Bcf/d Firm Gas Takeaway By 2018 Cove Point |
|
|
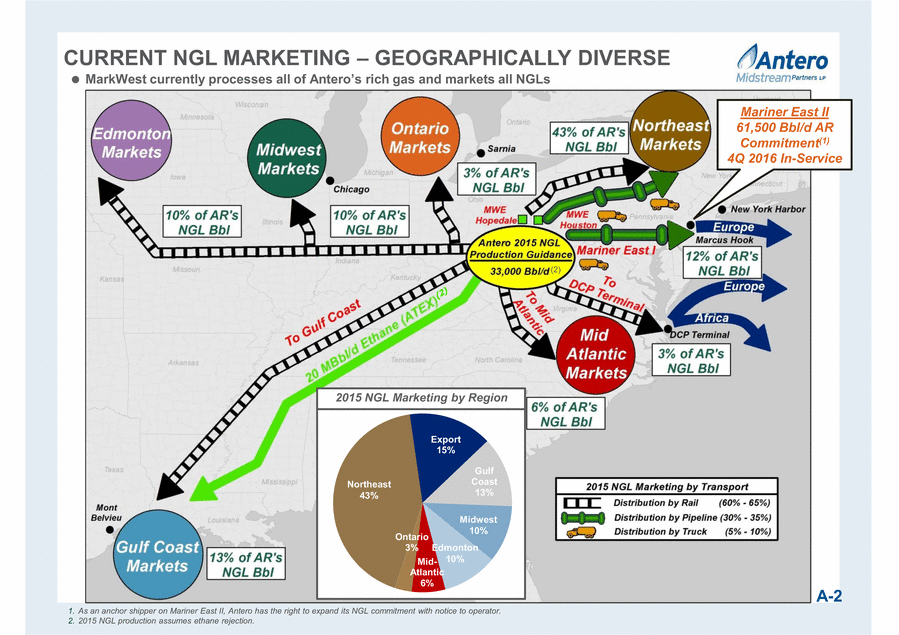
CURRENT NGL MARKETING GEOGRAPHICALLY DIVERSE 1. As an anchor shipper on Mariner East II, Antero has the right to expand its NGL commitment with notice to operator. 2. 2015 NGL production assumes ethane rejection. A-2 Mariner East II 61,500 Bbl/d AR Commitment(1) 4Q 2016 In-Service Export 15% Gulf Coast 13% Mid- Atlantic 6% Ontario 3% Northeast 43% Midwest 10% Edmonton 10% 2015 NGL Marketing by Region (2) |
|
|
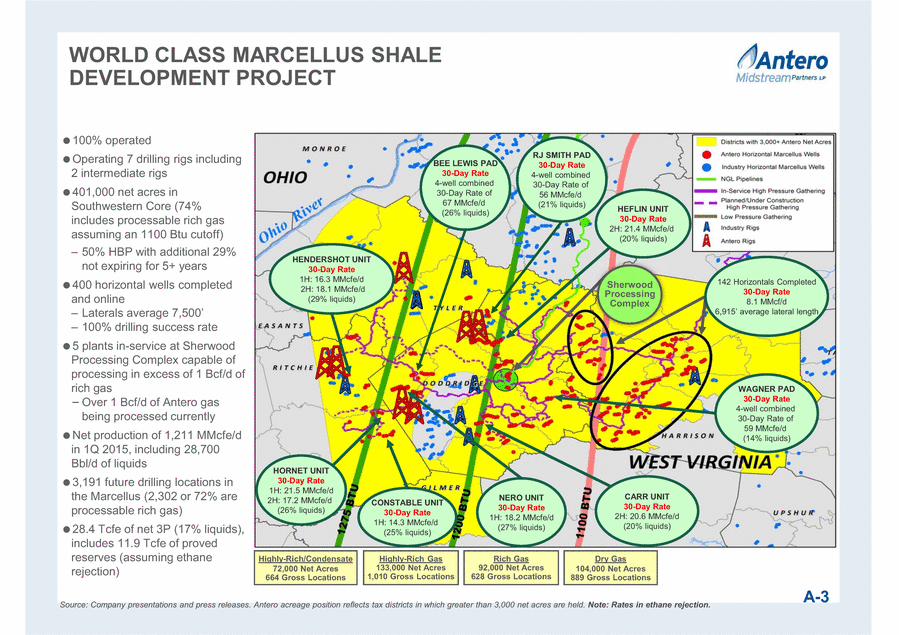
WORLD CLASS MARCELLUS SHALE DEVELOPMENT PROJECT 100% operated Operating 7 drilling rigs including 2 intermediate rigs 401,000 net acres in Southwestern Core (74% includes processable rich gas assuming an 1100 Btu cutoff) 50% HBP with additional 29% not expiring for 5+ years 400 horizontal wells completed and online 100% drilling success rate 5 plants in-service at Sherwood Processing Complex capable of processing in excess of 1 Bcf/d of rich gas Over 1 Bcf/d of Antero gas being processed currently Net production of 1,211 MMcfe/d in 1Q 2015, including 28,700 Bbl/d of liquids 3,191 future drilling locations in the Marcellus (2,302 or 72% are processable rich gas) 28.4 Tcfe of net 3P (17% liquids), includes 11.9 Tcfe of proved reserves (assuming ethane rejection) Highly-Rich Gas 133,000 Net Acres 1,010 Gross Locations Rich Gas 92,000 Net Acres 628 Gross Locations Dry Gas 104,000 Net Acres 889 Gross Locations Highly-Rich/Condensate 72,000 Net Acres 664 Gross Locations HEFLIN UNIT 30-Day Rate 2H: 21.4 MMcfe/d (20% liquids) CONSTABLE UNIT 30-Day Rate 1H: 14.3 MMcfe/d (25% liquids) 142 Horizontals Completed 30-Day Rate 8.1 MMcf/d Sherwood Processing Complex Source: Company presentations and press releases. Antero acreage position reflects tax districts in which greater than 3,000 net acres are held. Note: Rates in ethane rejection. NERO UNIT 30-Day Rate 1H: 18.2 MMcfe/d (27% liquids) BEE LEWIS PAD 30-Day Rate 4-well combined 30-Day Rate of 67 MMcfe/d (26% liquids) RJ SMITH PAD 30-Day Rate 4-well combined 30-Day Rate of 56 MMcfe/d (21% liquids) A-3 HENDERSHOT UNIT 30-Day Rate 1H: 16.3 MMcfe/d 2H: 18.1 MMcfe/d (29% liquids) HORNET UNIT 30-Day Rate 1H: 21.5 MMcfe/d 2H: 17.2 MMcfe/d (26% liquids) CARR UNIT 30-Day Rate 2H: 20.6 MMcfe/d (20% liquids) WAGNER PAD 30-Day Rate 4-well combined 30-Day Rate of 59 MMcfe/d (14% liquids) |
|
|
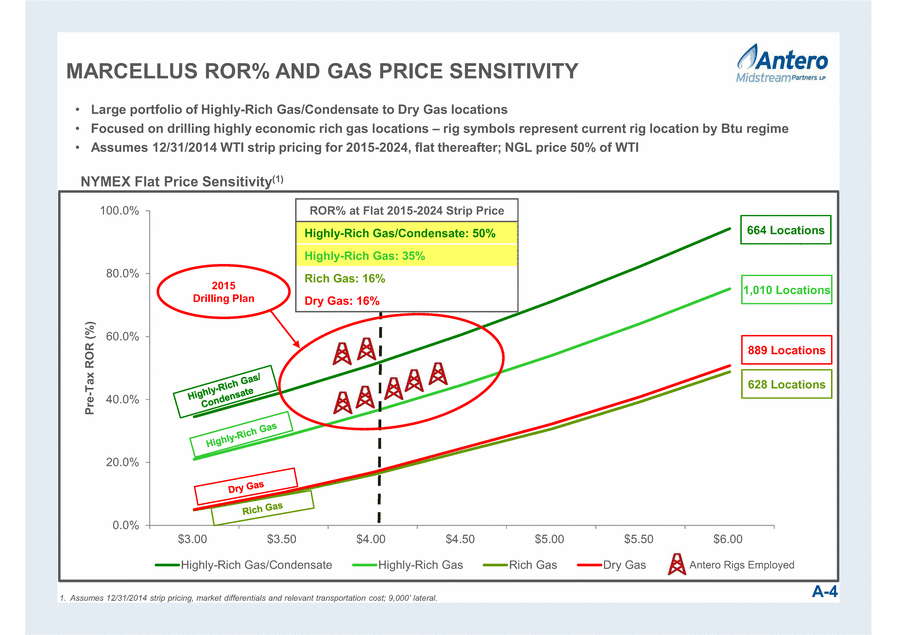
0.0% 20.0% 40.0% 60.0% 80.0% 100.0% $3.00 $3.50 $4.00 $4.50 $5.00 $5.50 $6.00 Pre-Tax ROR (%) Highly-Rich Gas/Condensate Highly-Rich Gas Rich Gas Dry Gas MARCELLUS ROR% AND GAS PRICE SENSITIVITY A-4 1. Large portfolio of Highly-Rich Gas/Condensate to Dry Gas locations Focused on drilling highly economic rich gas locations rig symbols represent current rig location by Btu regime Assumes 12/31/2014 WTI strip pricing for 2015-2024, flat thereafter; NGL price 50% of WTI NYMEX Flat Price Sensitivity(1) ROR% at Flat 2015-2024 Strip Price Highly-Rich Gas/Condensate: 50% Highly-Rich Gas: 35% Rich Gas: 16% Dry Gas: 16% 664 Locations 1,010 Locations 628 Locations 889 Locations Antero Rigs Employed 2015 Drilling Plan |
|
|
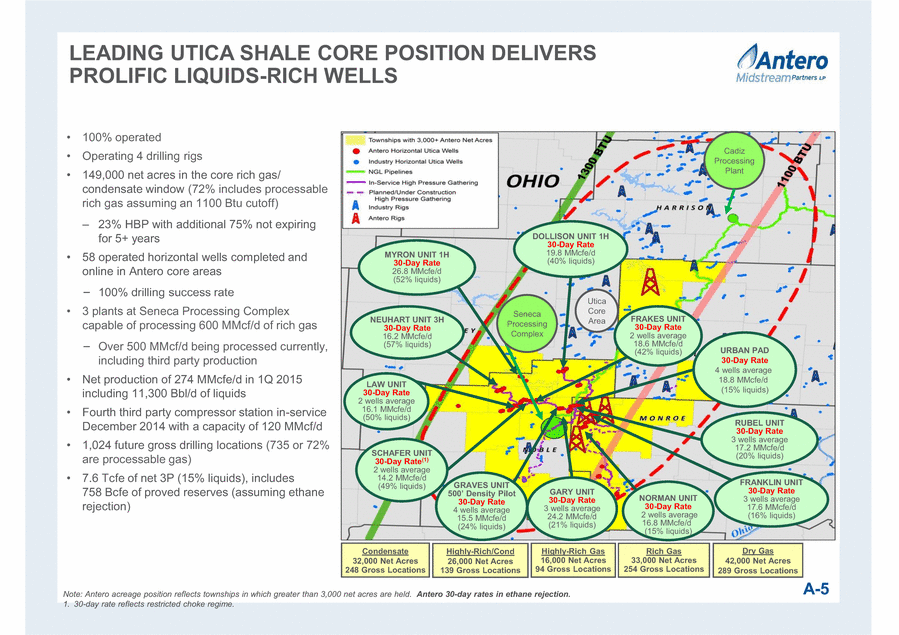
Note: Antero acreage position reflects townships in which greater than 3,000 net acres are held. Antero 30-day rates in ethane rejection. 1. 30-day rate reflects restricted choke regime. 100% operated Operating 4 drilling rigs 149,000 net acres in the core rich gas / condensate window (72% includes processable rich gas assuming an 1100 Btu cutoff) 23% HBP with additional 75% not expiring for 5+ years 58 operated horizontal wells completed and online in Antero core areas 100% drilling success rate 3 plants at Seneca Processing Complex capable of processing 600 MMcf/d of rich gas Over 500 MMcf/d being processed currently, including third party production Net production of 274 MMcfe/d in 1Q 2015 including 11,300 Bbl/d of liquids Fourth third party compressor station in-service December 2014 with a capacity of 120 MMcf/d 1,024 future gross drilling locations (735 or 72% are processable gas) 7.6 Tcfe of net 3P (15% liquids), includes 758 Bcfe of proved reserves (assuming ethane rejection) LEADING UTICA SHALE CORE POSITION DELIVERS PROLIFIC LIQUIDS-RICH WELLS A-5 Cadiz Processing Plant NORMAN UNIT 30-Day Rate 2 wells average 16.8 MMcfe/d (15% liquids) RUBEL UNIT 30-Day Rate 3 wells average 17.2 MMcfe/d (20% liquids) Utica Core Area GARY UNIT 30-Day Rate 3 wells average 24.2 MMcfe/d (21% liquids) Highly-Rich/Cond 26,000 Net Acres 139 Gross Locations Highly-Rich Gas 16,000 Net Acres 94 Gross Locations Rich Gas 33,000 Net Acres 254 Gross Locations Dry Gas 42,000 Net Acres 289 Gross Locations NEUHART UNIT 3H 30-Day Rate 16.2 MMcfe/d (57% liquids) Condensate 32,000 Net Acres 248 Gross Locations DOLLISON UNIT 1H 30-Day Rate 19.8 MMcfe/d (40% liquids) MYRON UNIT 1H 30-Day Rate 26.8 MMcfe/d (52% liquids) Seneca Processing Complex LAW UNIT 30-Day Rate 2 wells average 16.1 MMcfe/d (50% liquids) SCHAFER UNIT 30-Day Rate(1) 2 wells average 14.2 MMcfe/d (49% liquids) URBAN PAD 30-Day Rate 4 wells average 18.8 MMcfe/d (15% liquids) GRAVES UNIT 30-Day Rate 4 wells average 15.5 MMcfe/d (24% liquids) FRANKLIN UNIT 30-Day Rate 3 wells average 17.6 MMcfe/d (16% liquids) FRAKES UNIT 30-Day Rate 2 wells average 18.6 MMcfe/d (42% liquids) |
|
|
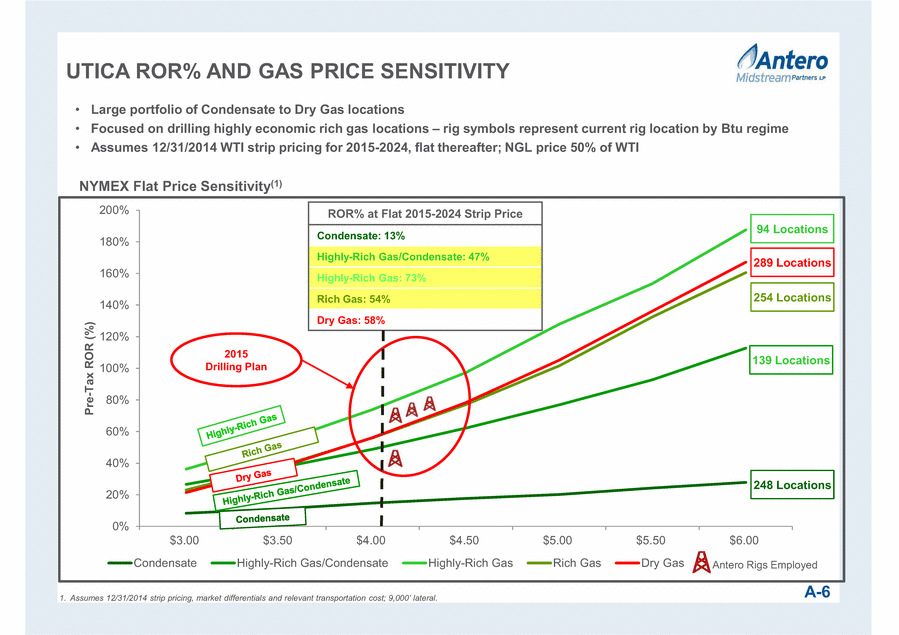
0% 20% 40% 60% 80% 100% 120% 140% 160% 180% 200% $3.00 $3.50 $4.00 $4.50 $5.00 $5.50 $6.00 Pre-Tax ROR (%) Condensate Highly-Rich Gas/Condensate Highly-Rich Gas Rich Gas Dry Gas Antero Rigs Employed UTICA ROR% AND GAS PRICE SENSITIVITY A-6 NYMEX Flat Price Sensitivity(1) 94 Locations ROR% at Flat 2015-2024 Strip Price Condensate: 13% Highly-Rich Gas/Condensate: 47% Highly-Rich Gas: 73% Rich Gas: 54% Dry Gas: 58% Large portfolio of Condensate to Dry Gas locations Focused on drilling highly economic rich gas locations rig symbols represent current rig location by Btu regime Assumes 12/31/2014 WTI strip pricing for 2015-2024, flat thereafter; NGL price 50% of WTI 1. 254 Locations 139 Locations 289 Locations 248 Locations 2015 Drilling Plan |
|
|
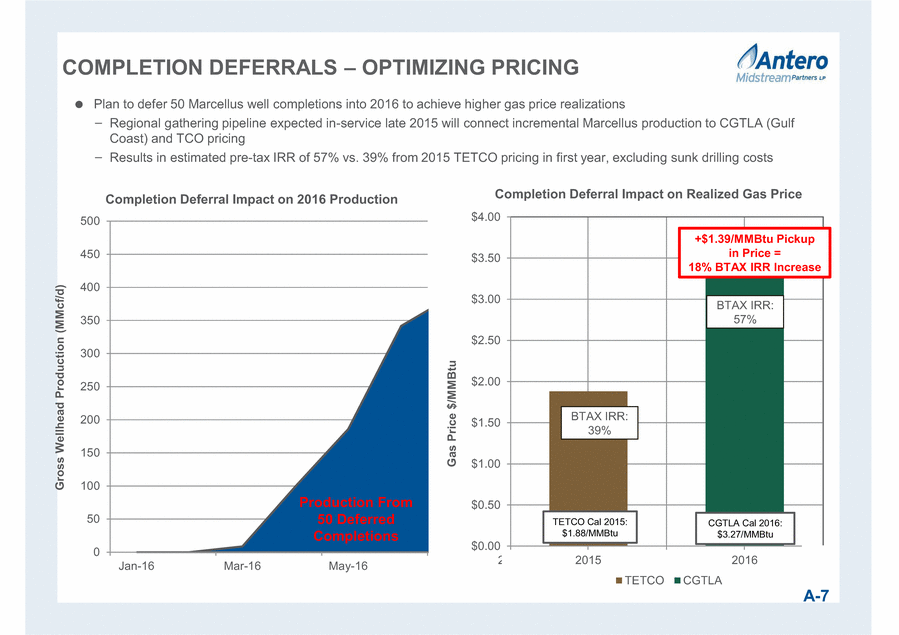
$0.00 $0.50 $1.00 $1.50 $2.00 $2.50 $3.00 $3.50 $4.00 2015 2015 2016 2016 2017 Gas Price $/MMBtu Completion Deferral Impact on Realized Gas Price TETCO CGTLA TETCO Cal 2015: $1.88/MMBtu CGTLA Cal 2016: $3.27/MMBtu BTAX IRR: 57% A-7 Plan to defer 50 Marcellus well completions into 2016 to achieve higher gas price realizations Regional gathering pipeline expected in-service late 2015 will connect incremental Marcellus production to CGTLA (Gulf Coast) and TCO pricing Results in estimated pre-tax IRR of 57% vs. 39% from 2015 TETCO pricing in first year, excluding sunk drilling costs COMPLETION DEFERRALS OPTIMIZING PRICING 0 50 100 150 200 250 300 350 400 450 500 Jan-16 Mar-16 May-16 Gross Wellhead Production (MMcf/d) Completion Deferral Impact on 2016 Production Production From 50 Deferred Completions +$1.39/MMBtu Pickup in Price = 18% BTAX IRR Increase BTAX IRR: 39% |
|
|
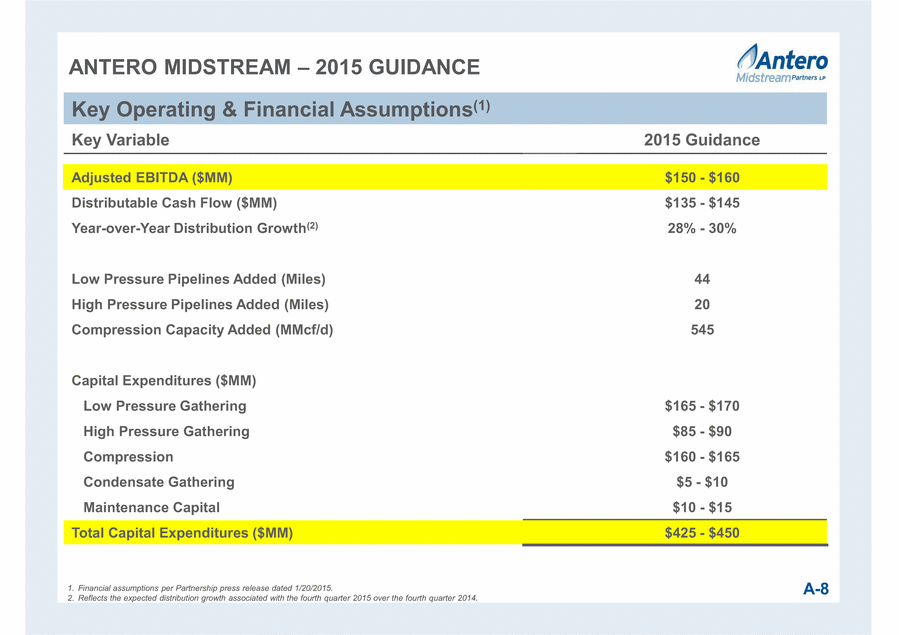
ANTERO MIDSTREAM – 2015 GUIDANCE Key Variable 2015 Guidance Adjusted EBITDA ($MM) $150 - $160 Distributable Cash Flow ($MM) $135 - $145 Year-over-Year Distribution Growth(2) 28% - 30% Low Pressure Pipelines Added (Miles) 44 High Pressure Pipelines Added (Miles) 20 Compression Capacity Added (MMcf/d) 545 Capital Expenditures ($MM) Low Pressure Gathering $165 - $170 High Pressure Gathering $85 - $90 Compression $160 - $165 Condensate Gathering $5 - $10 Maintenance Capital $10 - $15 Total Capital Expenditures ($MM) $425 - $450 1. Financial assumptions per Partnership press release dated 1/20/2015. 2. Reflects the expected distribution growth associated with the fourth quarter 2015 over the fourth quarter 2014. Key Operating & Financial Assumptions(1) A-8 |
|
|
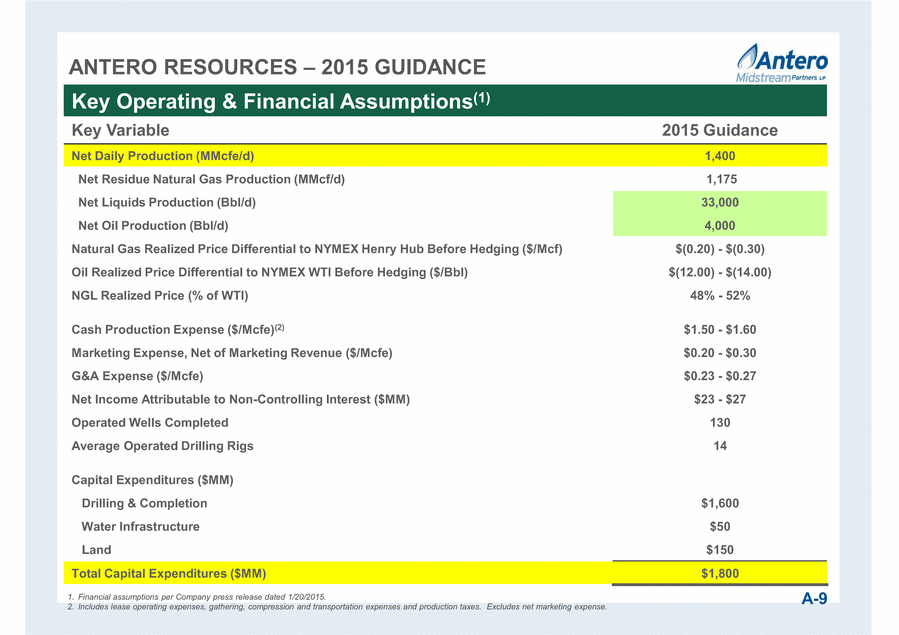
ANTERO RESOURCES – 2015 GUIDANCE Key Variable 2015 Guidance Net Daily Production (MMcfe/d) 1,400 Net Residue Natural Gas Production (MMcf/d) 1,175 Net Liquids Production (Bbl/d) 33,000 Net Oil Production (Bbl/d) 4,000 Natural Gas Realized Price Differential to NYMEX Henry Hub Before Hedging ($/Mcf) $(0.20) - $(0.30) Oil Realized Price Differential to NYMEX WTI Before Hedging ($/Bbl) $(12.00) - $(14.00) NGL Realized Price (% of WTI) 48% - 52% Cash Production Expense ($/Mcfe)(2) $1.50 - $1.60 Marketing Expense, Net of Marketing Revenue ($/Mcfe) $0.20 - $0.30 G&A Expense ($/Mcfe) $0.23 - $0.27 Net Income Attributable to Non-Controlling Interest ($MM) $23 - $27 Operated Wells Completed 130 Average Operated Drilling Rigs 14 Capital Expenditures ($MM) Drilling & Completion $1,600 Water Infrastructure $50 Land $150 Total Capital Expenditures ($MM) $1,800 1. Financial assumptions per Company press release dated 1/20/2015. 2. Includes lease operating expenses, gathering, compression and transportation expenses and production taxes. Excludes net marketing expense. Key Operating & Financial Assumptions(1) A-9 |
|
|
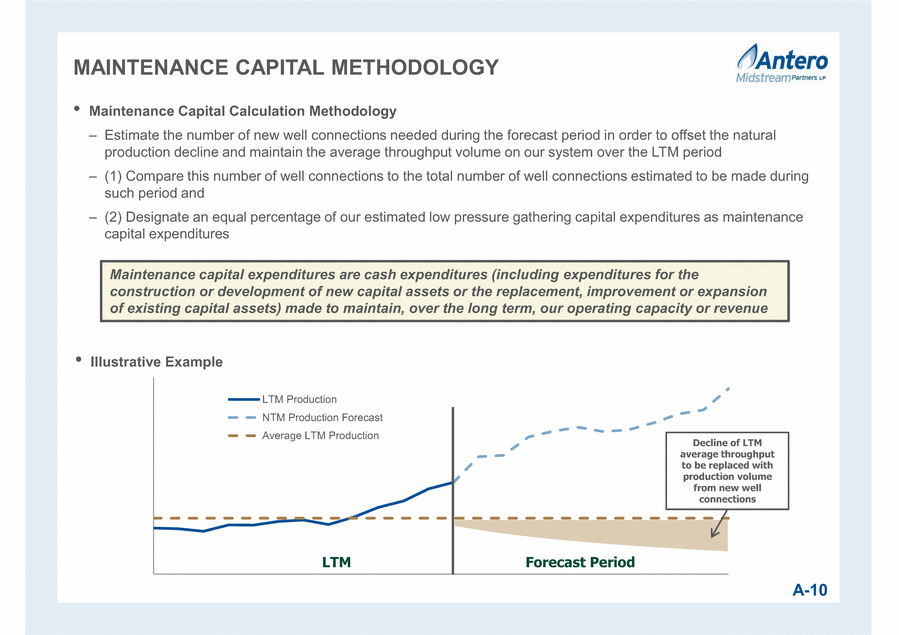
LTM Production NTM Production Forecast Average LTM Production MAINTENANCE CAPITAL METHODOLOGY Maintenance Capital Calculation Methodology Estimate the number of new well connections needed during the forecast period in order to offset the natural production decline and maintain the average throughput volume on our system over the LTM period (1) Compare this number of well connections to the total number of well connections estimated to be made during such period and (2) Designate an equal percentage of our estimated low pressure gathering capital expenditures as maintenance capital expenditures A-10 Maintenance capital expenditures are cash expenditures (including expenditures for the construction or development of new capital assets or the replacement, improvement or expansion of existing capital assets) made to maintain, over the long term, our operating capacity or revenue Illustrative Example LTM Forecast Period Decline of LTM average throughput to be replaced with production volume from new well connections |
|
|
CAUTIONARY NOTE The SEC permits oil and gas companies, in their filings with the SEC, to disclose only proved, probable and possible reserve estimates (collectively, “3P”). Antero has provided internally generated estimates for proved, probable and possible reserves in this presentation in accordance with SEC guidelines and definitions, which have been audited by Antero’s third-party engineers. Unless otherwise noted, reserve estimates as of December 31, 2014 assume ethane rejection and strip pricing. Actual quantities that may be ultimately recovered from Antero’s interests may differ substantially from the estimates in this presentation. Factors affecting ultimate recovery include the scope of Antero’s ongoing drilling program, which will be directly affected by commodity prices, the availability of capital, drilling and production costs, availability of drilling services and equipment, drilling results, lease expirations, transportation constraints, regulatory approvals and other factors, and actual drilling results, including geological and mechanical factors affecting recovery rates. In this presentation: •“3P reserves” refer to Antero’s estimated aggregate proved, probable and possible reserves as of December 31, 2014. The SEC prohibits companies from aggregating proved, probable and possible reserves in filings with the SEC due to the different levels of certainty associated with each reserve category. •“EUR,” or “Estimated Ultimate Recovery,” refers to Antero’s internal estimates of per well hydrocarbon quantities that may be potentially recovered from a hypothetical future well completed as a producer in the area. These quantities do not necessarily constitute or represent reserves within the meaning of the Society of Petroleum Engineer’s Petroleum Resource Management System or the SEC’s oil and natural gas disclosure rules. •“Condensate” refers to gas having a heat content between 1250 BTU and 1300 BTU in the Utica Shale. •“Highly-rich gas/condensate” refers to gas having a heat content between 1275 BTU and 1350 BTU in the Marcellus Shale and 1225 BTU and 1250 BTU in the Utica Shale. •“Highly-rich gas” refers to gas having a heat content between 1200 BTU and 1275 BTU in the Marcellus Shale and 1200 BTU and 1225 BTU in the Utica Shale. •“Rich gas” refers to gas having a heat content of between 1100 BTU and 1200 BTU. •“Dry gas” refers to gas containing insufficient quantities of hydrocarbons heavier than methane to allow their commercial extraction or to require their removal in order to render the gas suitable for fuel use. Regarding Hydrocarbon Quantities A-11 |